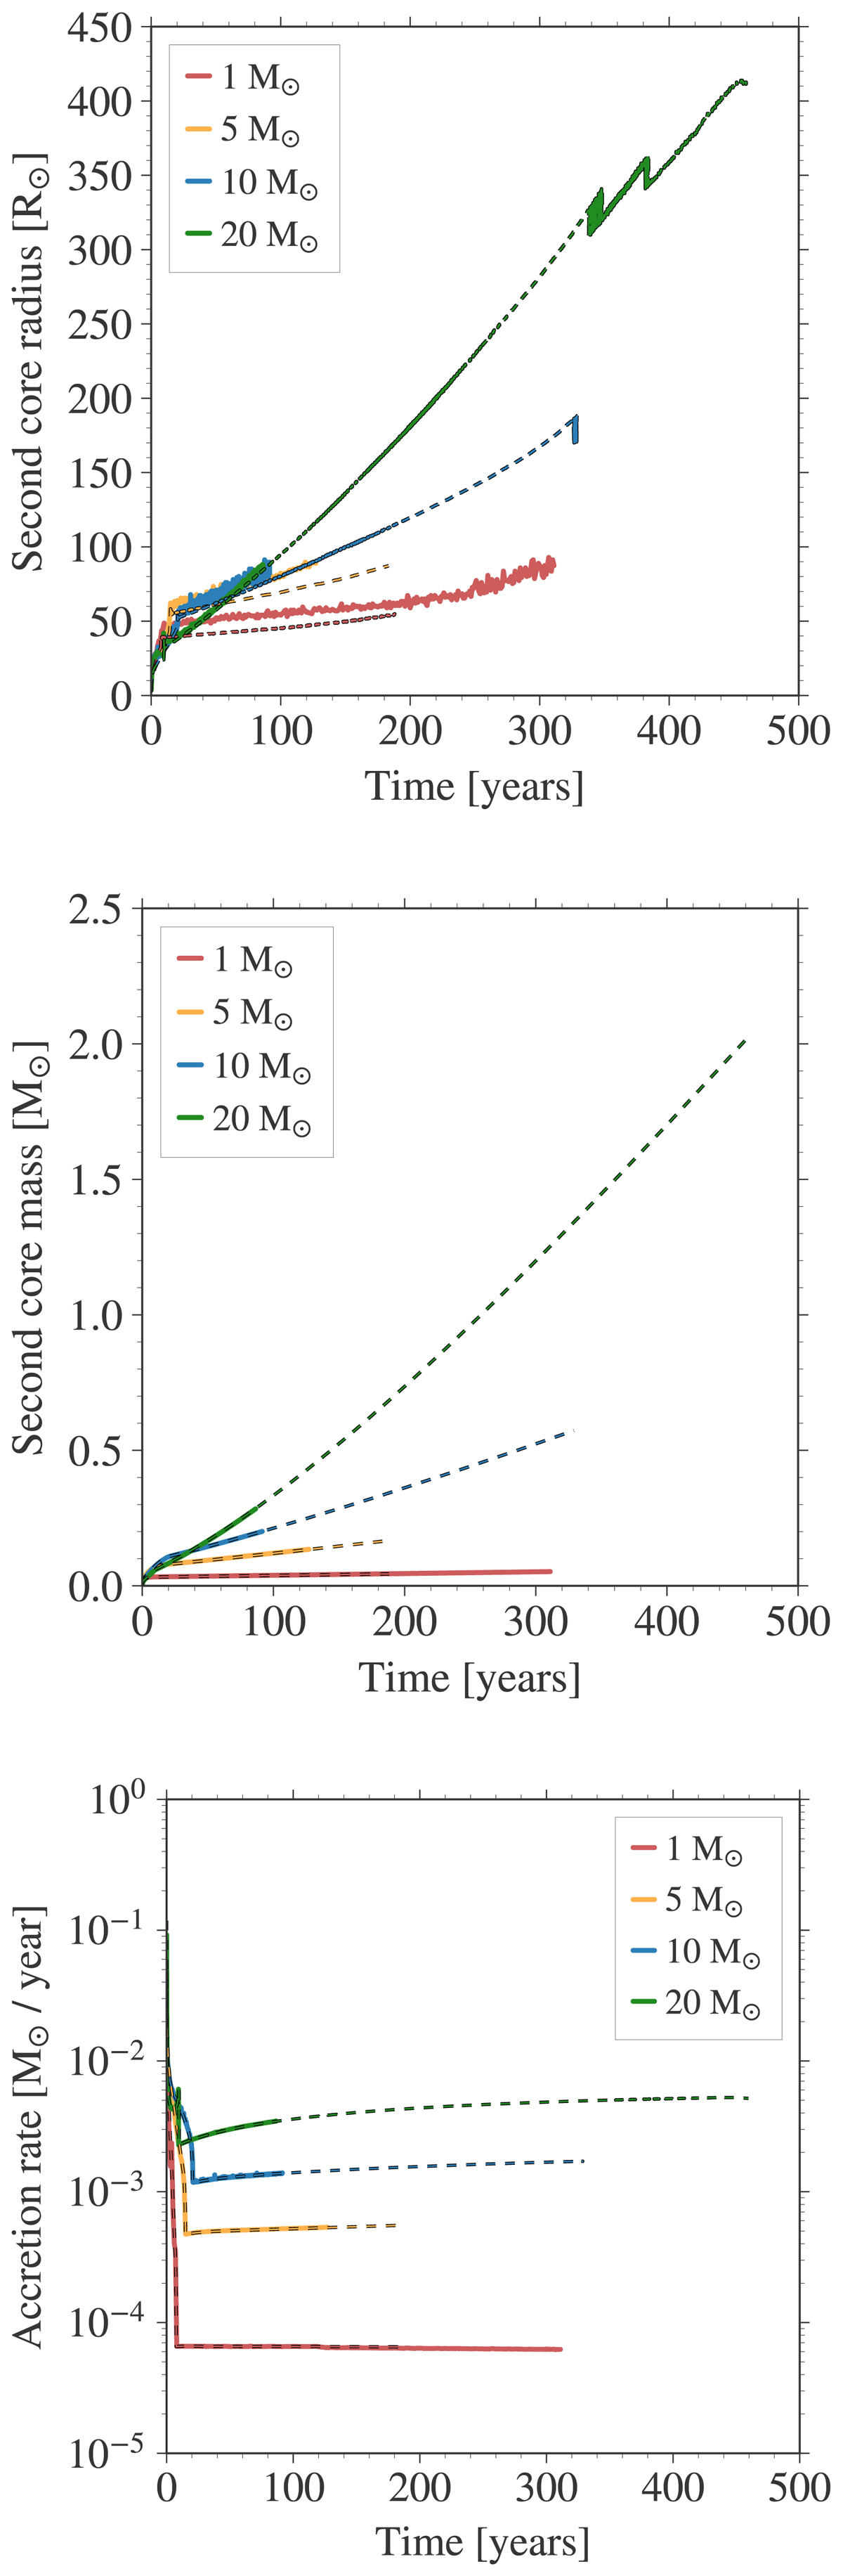
Fig. 13.
Download original image
Time evolution of the second core radius (top), mass (middle), and accretion rate (bottom) for the different core collapse scenarios with initial cloud core mass of 1 M⊙ (red), 5 M⊙ (yellow), 10 M⊙ (blue), and 20 M⊙ (green). The time t = 0 marks the onset of the second core formation. The overplotted dashed lines indicate the evolution from the high-resolution 1D simulations discussed in Sect. 3.2.
Current usage metrics show cumulative count of Article Views (full-text article views including HTML views, PDF and ePub downloads, according to the available data) and Abstracts Views on Vision4Press platform.
Data correspond to usage on the plateform after 2015. The current usage metrics is available 48-96 hours after online publication and is updated daily on week days.
Initial download of the metrics may take a while.