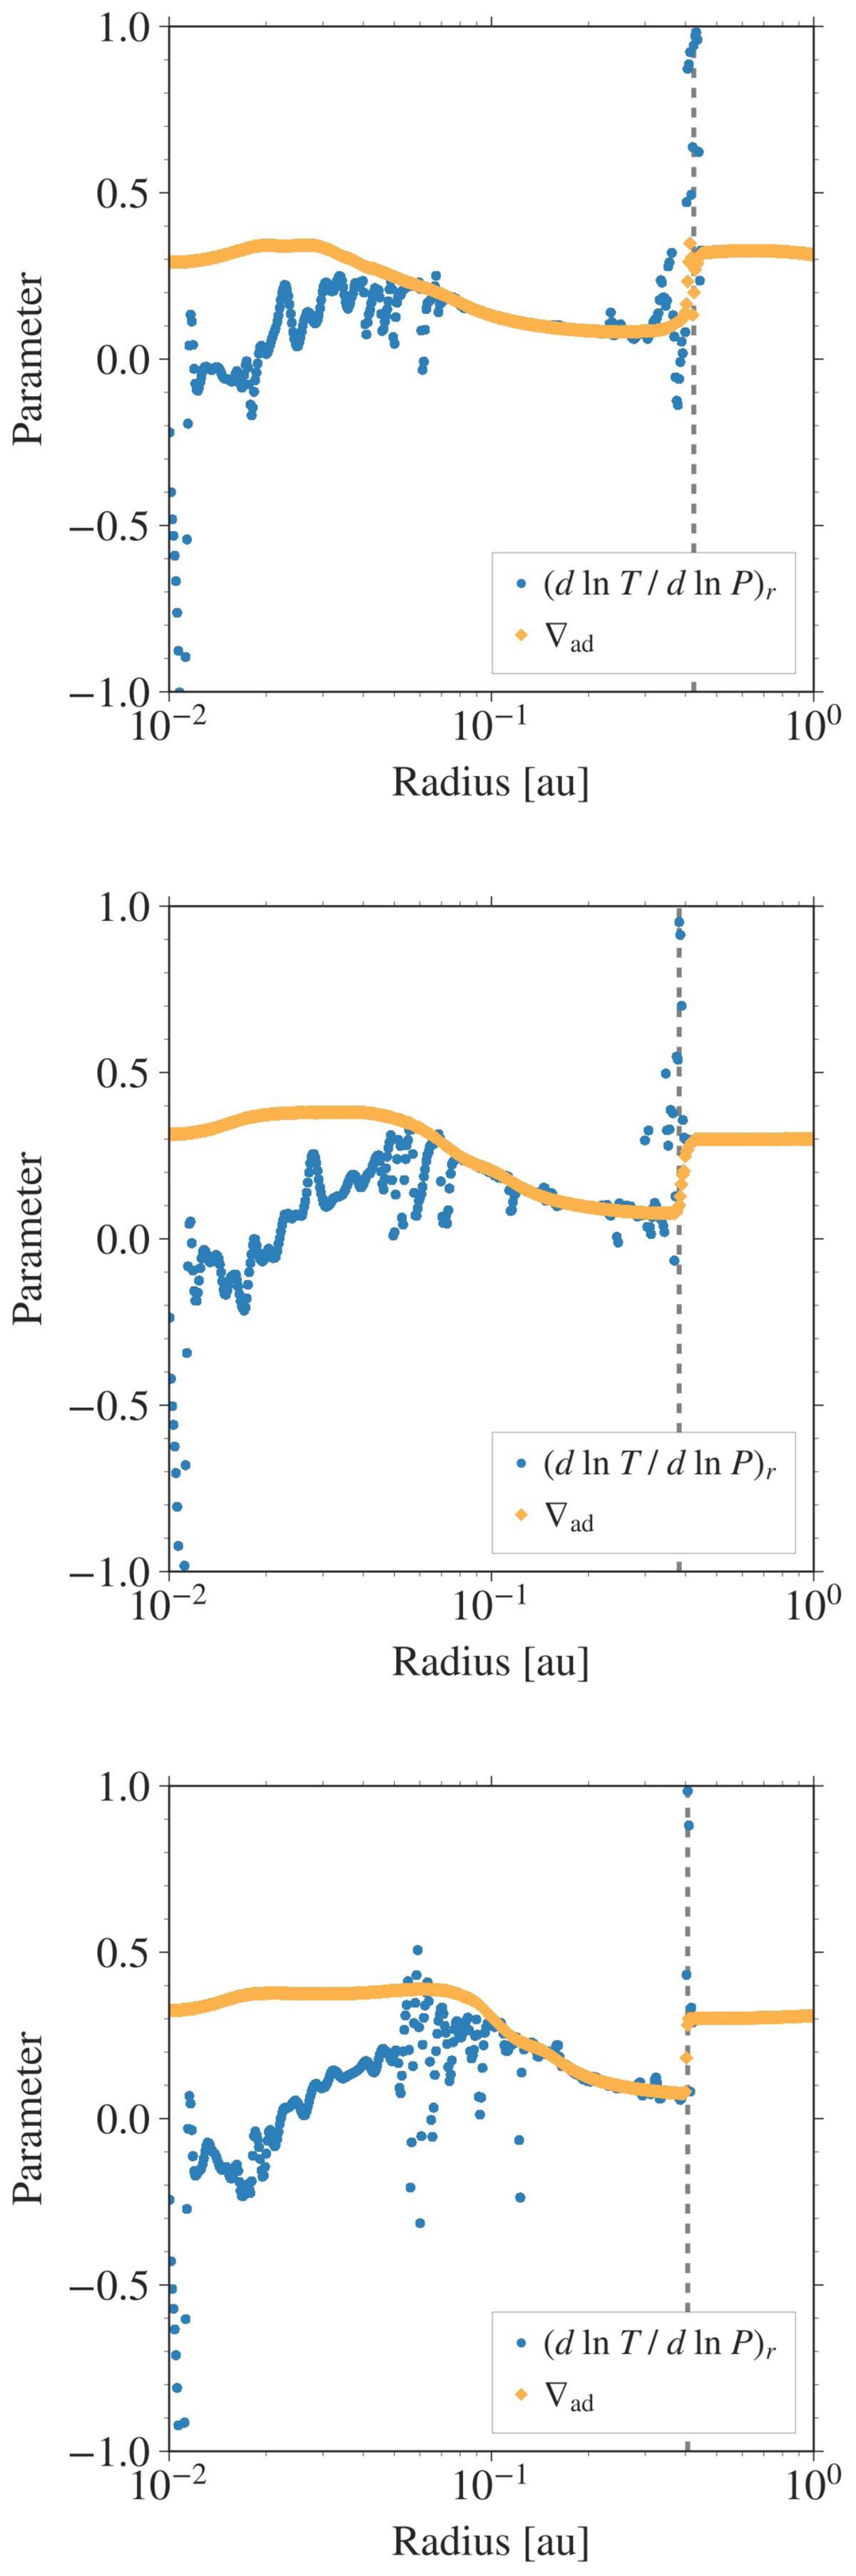
Fig. 12.
Download original image
Polar-angle averaged actual temperature gradient ∇act(r) compared to the polar-angle averaged adiabatic gradient ∇ad(ρ(r),T(r)) (see Eq. (7)) for the 5 M⊙ (top), 10 M⊙ (middle), and 20 M⊙ (bottom) initial cloud core masses. The indication for convective instability is not as prominent as in the 1 M⊙ case (see Fig. 9). The vertical grey dashed line indicates the radius of the second core. The plots are shown at 128 years, 91.4 years, and 86.4 years after the second core formation, for the 5 M⊙, 10 M⊙, and 20 M⊙ cases, respectively.
Current usage metrics show cumulative count of Article Views (full-text article views including HTML views, PDF and ePub downloads, according to the available data) and Abstracts Views on Vision4Press platform.
Data correspond to usage on the plateform after 2015. The current usage metrics is available 48-96 hours after online publication and is updated daily on week days.
Initial download of the metrics may take a while.