Fig. 8.
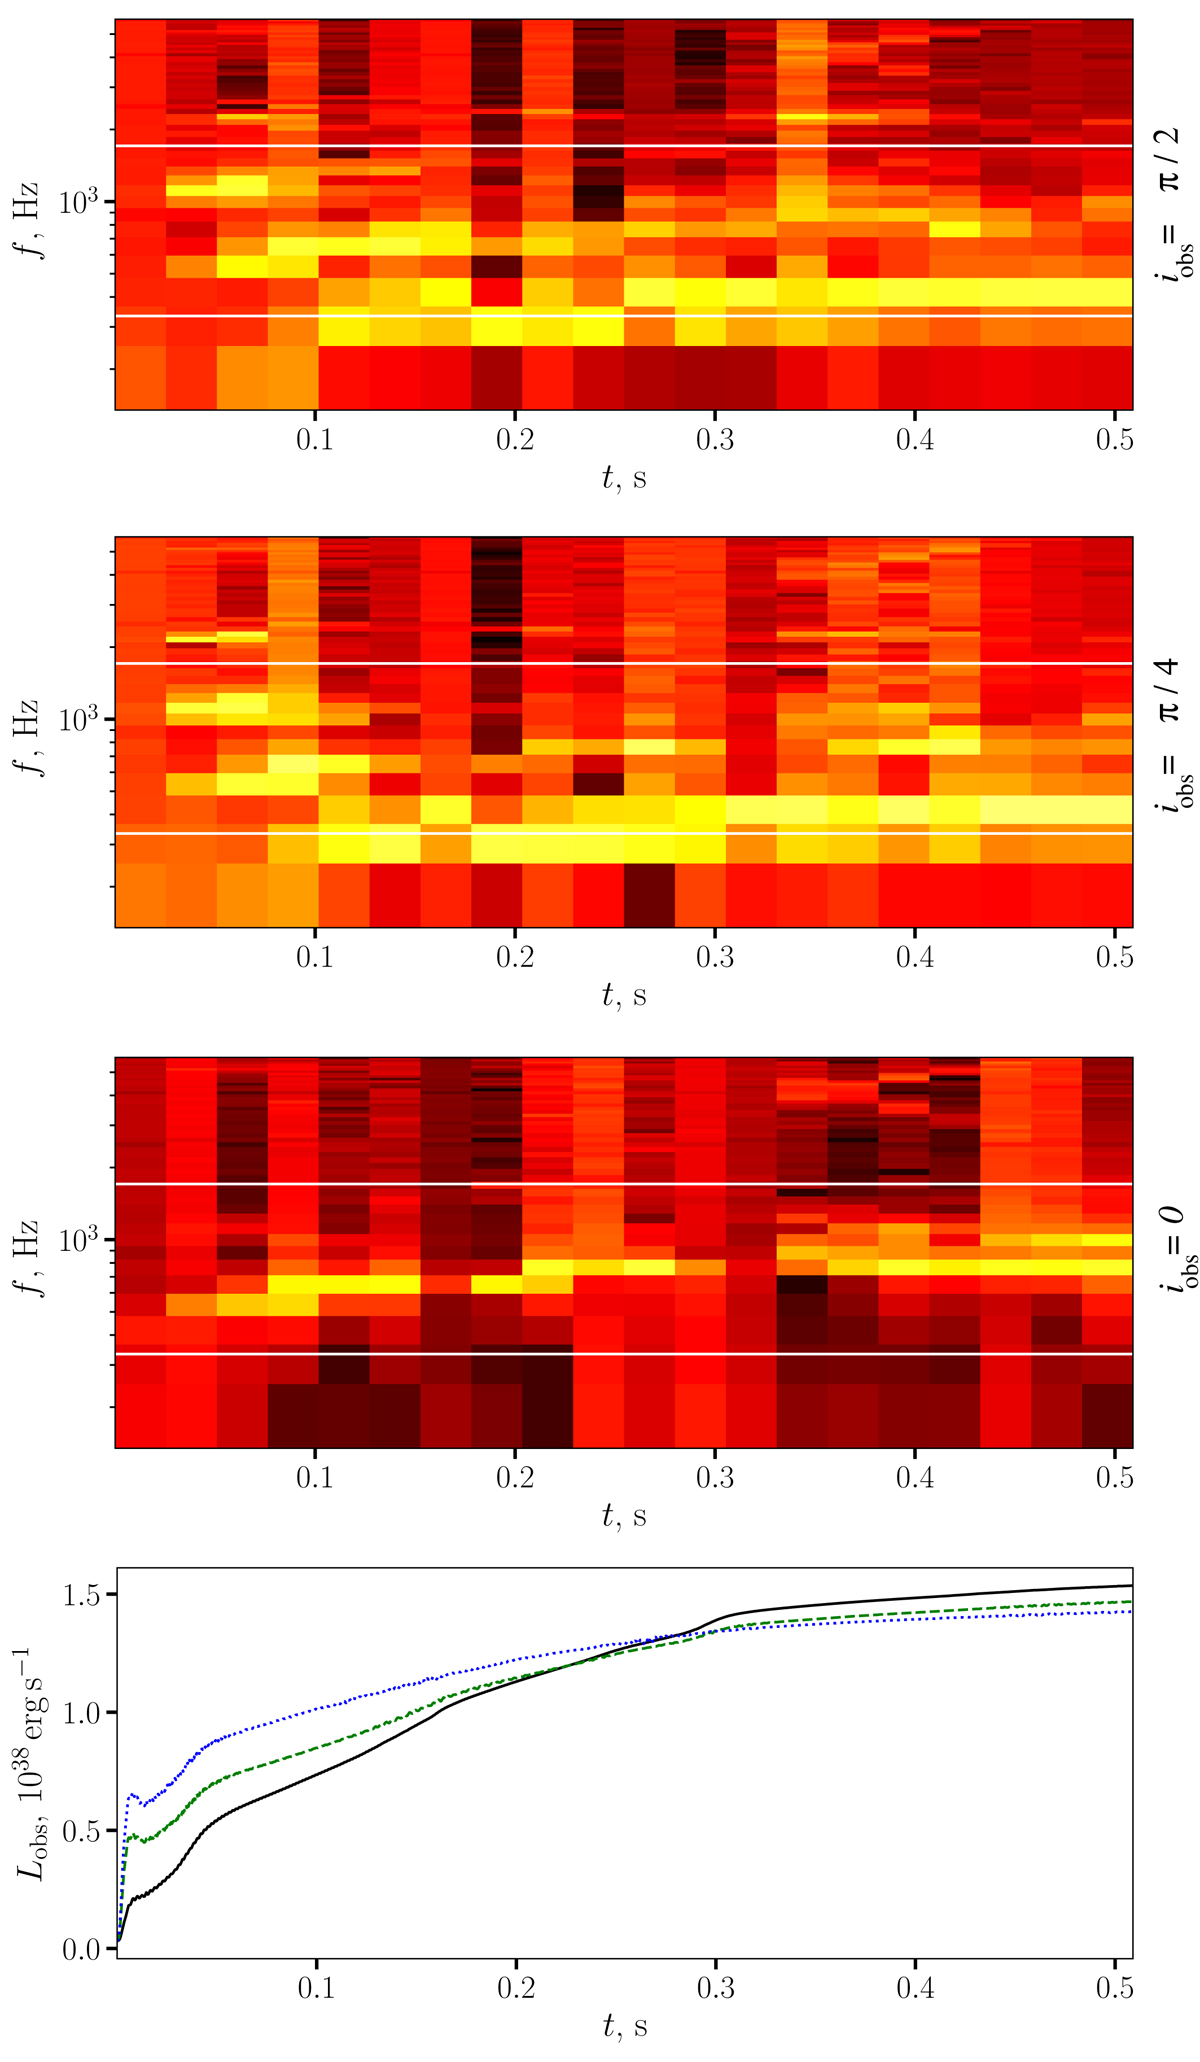
Dynamical PDSs (log10(f2PDS(f)) normalised to total power within a single time bin) for the “isotropic luminosity” calculated as described in Sect. 3.4 for the high-accretion-rate model 3LR. The three upper panels show dynamical spectra for the observer’s inclinations of π/2, π/4, and 0, respectively. White horizontal lines show the spin (lower) and Keplerian frequencies. Lowermost panel: corresponding light curves: iobs = π/2, π/4, and 0 cases are shown with blue dotted, green dashed, and black solid lines.
Current usage metrics show cumulative count of Article Views (full-text article views including HTML views, PDF and ePub downloads, according to the available data) and Abstracts Views on Vision4Press platform.
Data correspond to usage on the plateform after 2015. The current usage metrics is available 48-96 hours after online publication and is updated daily on week days.
Initial download of the metrics may take a while.