Fig. 6.
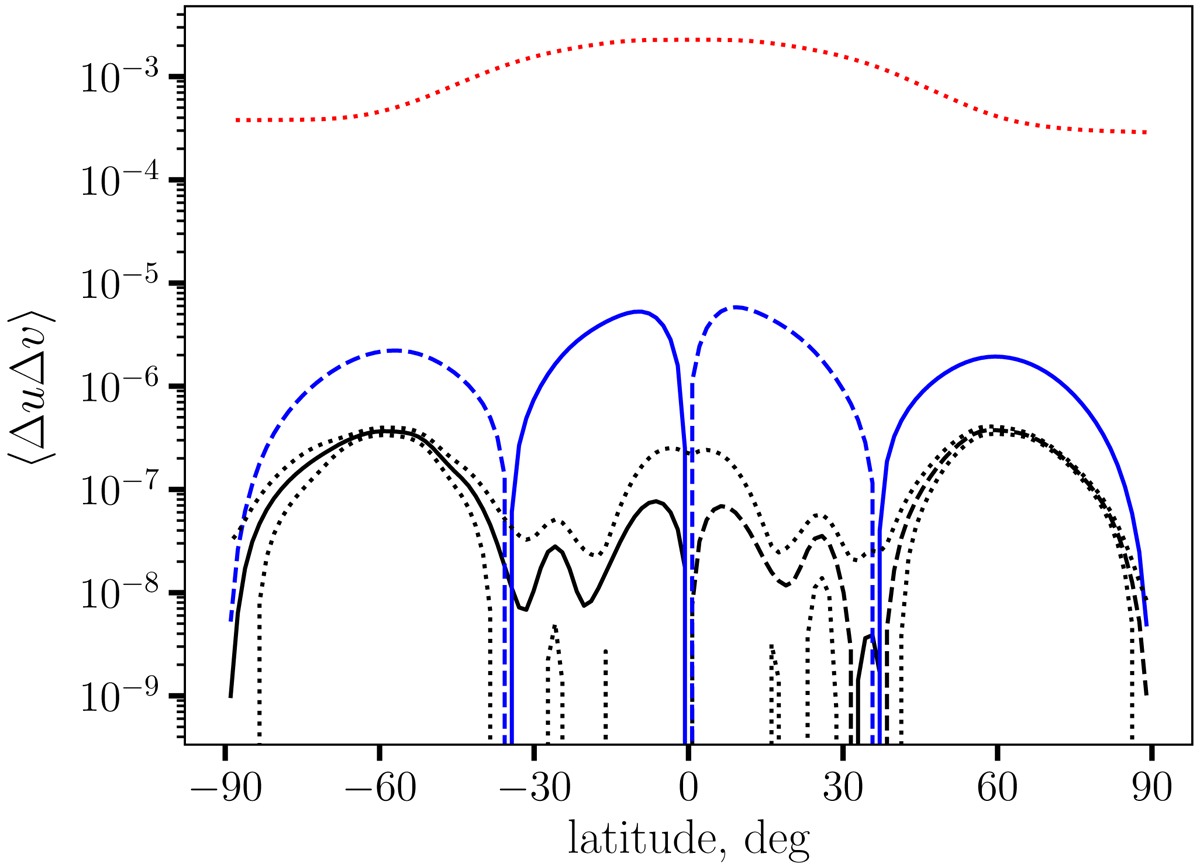
Azimuthally- and temporally averaged dynamical quantities for the high-accretion-rate model 3LR. Visualised quantities are Reynolds stress (black), mean velocity product vθvφ (blue), and sound velocity (red dotted) as functions of latitude. All the quantities were averaged over the period of time between 0.1 and 0.3 s, and over the azimuthal angle. Solid and dashed lines correspond to positive (southward motion or momentum transfer) and negative quantities (northward). Dotted black curves show the 1σ standard deviation interval for the Reynolds stress.
Current usage metrics show cumulative count of Article Views (full-text article views including HTML views, PDF and ePub downloads, according to the available data) and Abstracts Views on Vision4Press platform.
Data correspond to usage on the plateform after 2015. The current usage metrics is available 48-96 hours after online publication and is updated daily on week days.
Initial download of the metrics may take a while.