Fig. B.2.
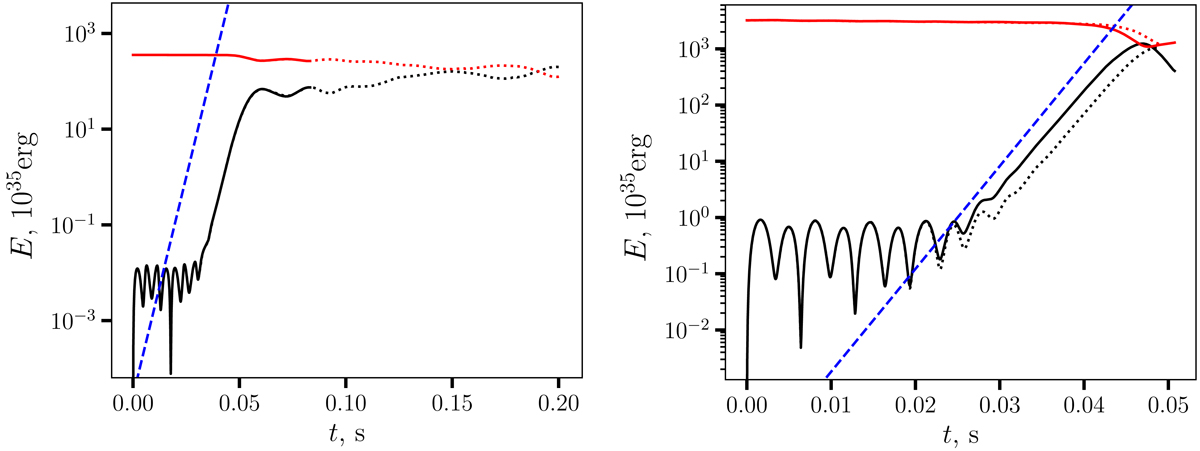
Energy evolution and relaxation for the split-sphere test, sub- (left panel) and super-sonic (right panel) cases. Black lines correspond to the part of kinetic energy related to vθ, red to vφ. Dotted lines are used for lower-resolution models (s)twistLR, solid lines for high-resolution (s)twistHR. Blue dashed lines show an exponential law ∝eΩ*t.
Current usage metrics show cumulative count of Article Views (full-text article views including HTML views, PDF and ePub downloads, according to the available data) and Abstracts Views on Vision4Press platform.
Data correspond to usage on the plateform after 2015. The current usage metrics is available 48-96 hours after online publication and is updated daily on week days.
Initial download of the metrics may take a while.