Free Access
Fig. B.1.
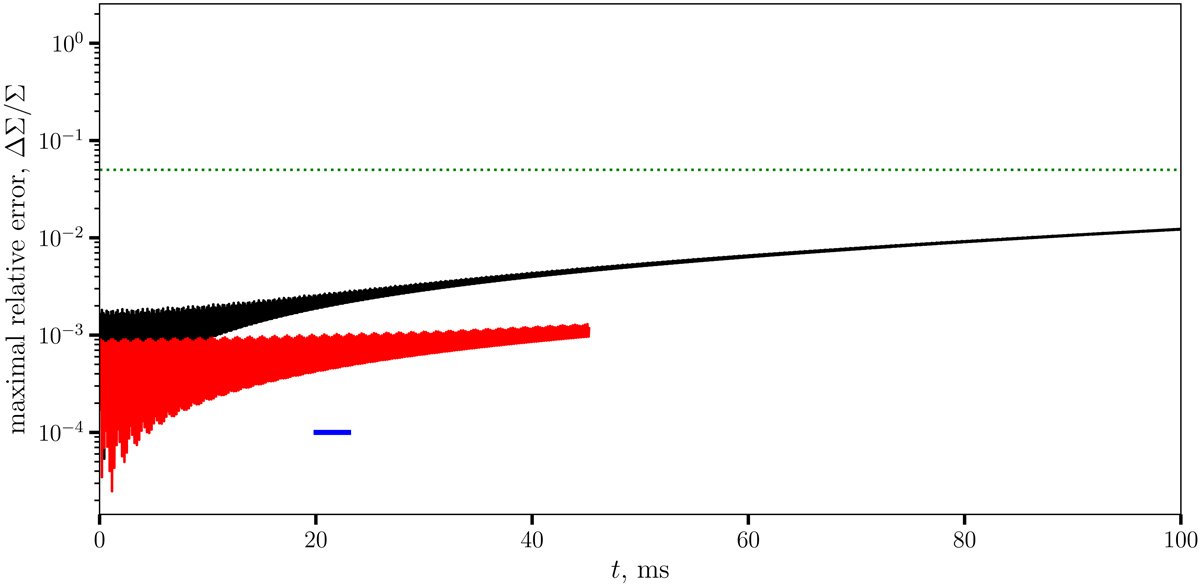
Maximal relative error in surface density ![]() for the test models NDLR (black) and NDHR (red). The blue horizontal segment in the lower panel has the length of one spin period. The dotted green horizontal line corresponds to the amplitude of the initial perturbation, 0.05.
for the test models NDLR (black) and NDHR (red). The blue horizontal segment in the lower panel has the length of one spin period. The dotted green horizontal line corresponds to the amplitude of the initial perturbation, 0.05.
Current usage metrics show cumulative count of Article Views (full-text article views including HTML views, PDF and ePub downloads, according to the available data) and Abstracts Views on Vision4Press platform.
Data correspond to usage on the plateform after 2015. The current usage metrics is available 48-96 hours after online publication and is updated daily on week days.
Initial download of the metrics may take a while.