Fig. 16.
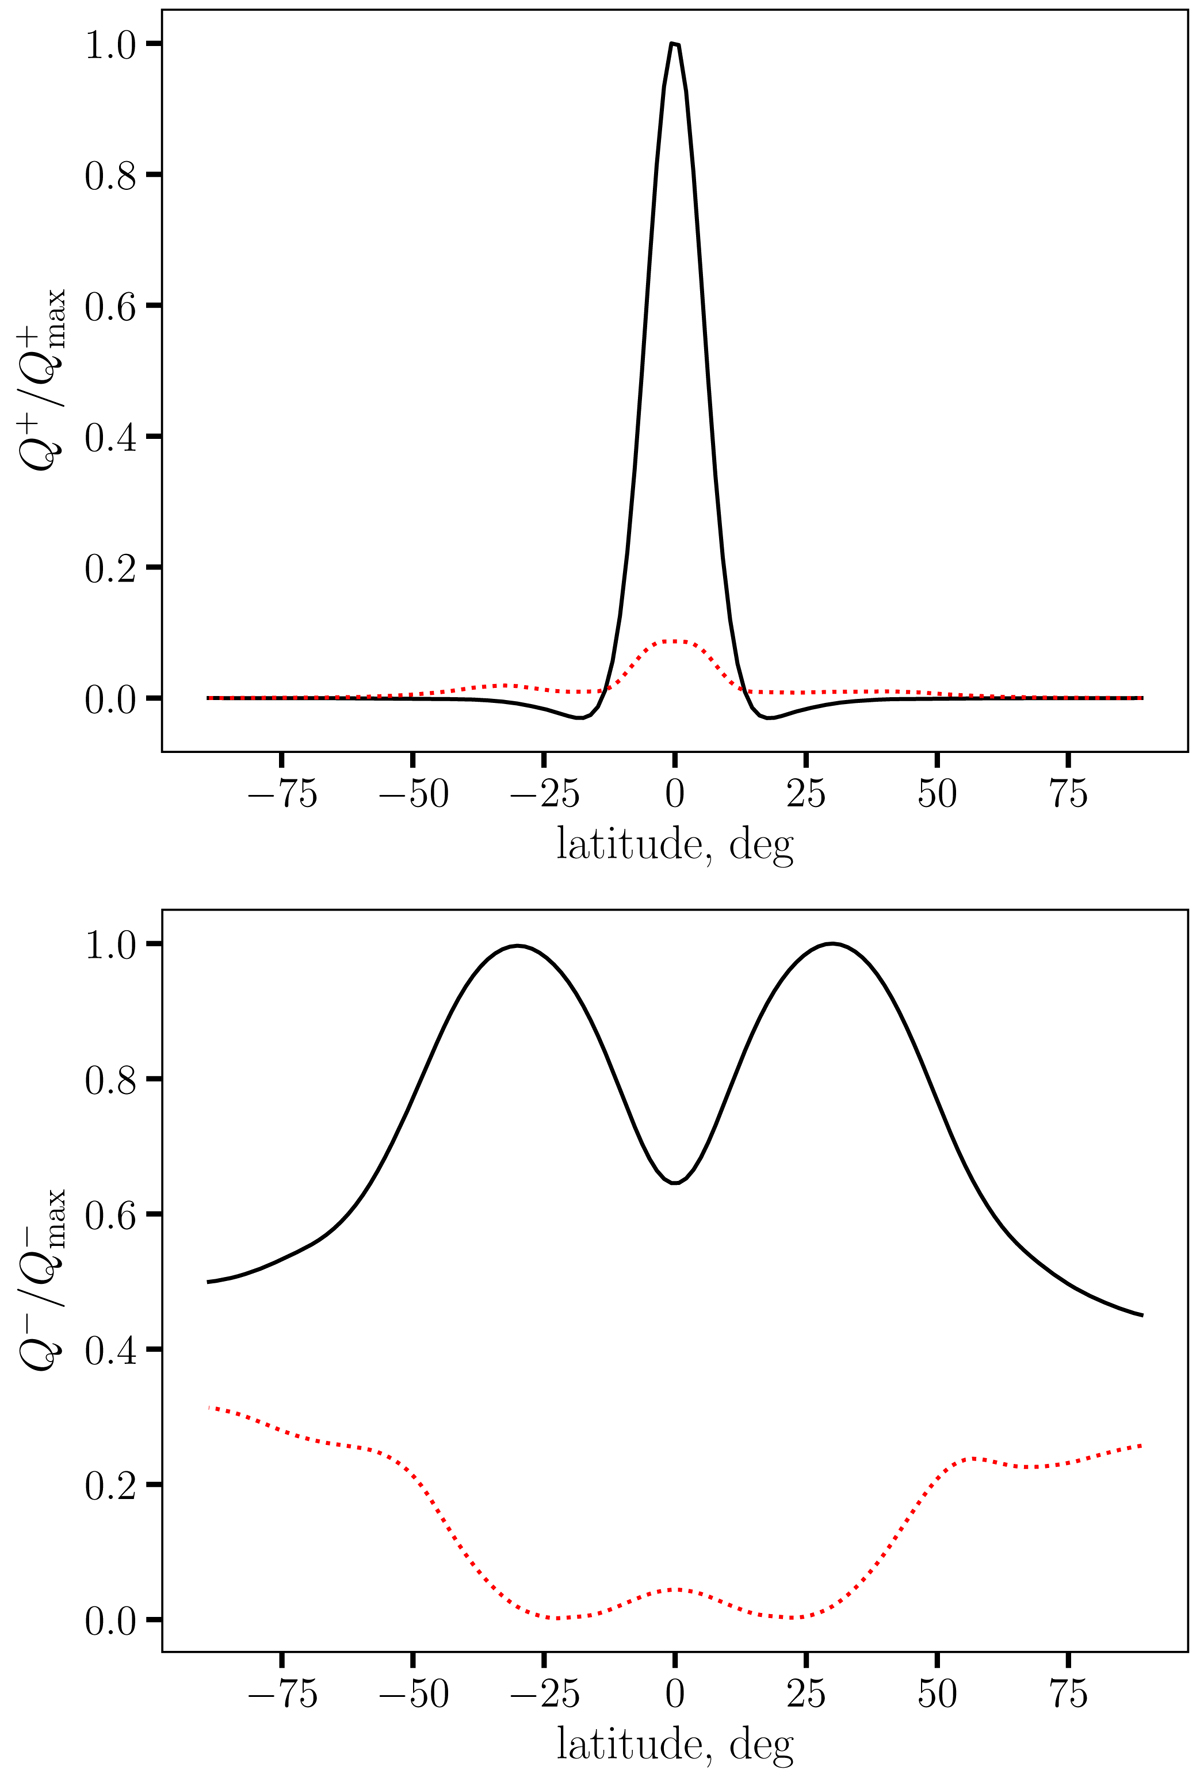
Time- and longitude-averaged energy dissipation (upper panel) and radiation flux (lower panel) for the high-accretion-rate 3LR simulation run. Mean values and root-mean-square deviations are shown, respectively, with black solid and red dotted curves. In each panel, the relevant quantity is normalised by the maximal averaged value.
Current usage metrics show cumulative count of Article Views (full-text article views including HTML views, PDF and ePub downloads, according to the available data) and Abstracts Views on Vision4Press platform.
Data correspond to usage on the plateform after 2015. The current usage metrics is available 48-96 hours after online publication and is updated daily on week days.
Initial download of the metrics may take a while.