Fig. 11.
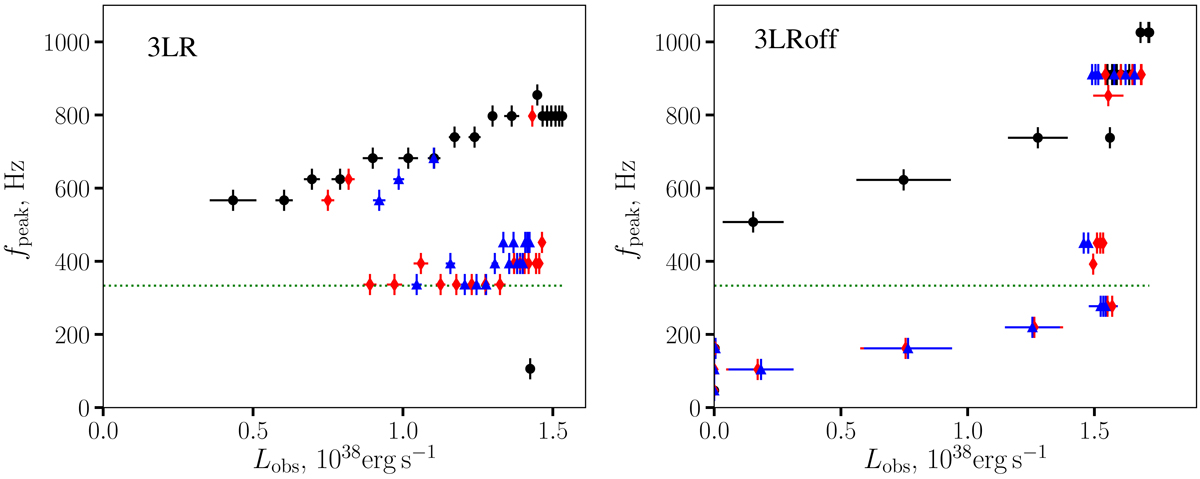
Peak frequency (calculated as the position of the maximum of f × PDS) as a function of observed luminosity (calculated using expression (36)) for iobs = 0 (black circles), π/4 (red diamonds), and π/2 (blue triangles). Simulation runs 3LR (left) and 3LRoff (right). Error bars show flux dispersion within the time bin and the size of the frequency bin where the maximum was detected. Horizontal dotted green lines show spin frequency.
Current usage metrics show cumulative count of Article Views (full-text article views including HTML views, PDF and ePub downloads, according to the available data) and Abstracts Views on Vision4Press platform.
Data correspond to usage on the plateform after 2015. The current usage metrics is available 48-96 hours after online publication and is updated daily on week days.
Initial download of the metrics may take a while.