Fig. 1
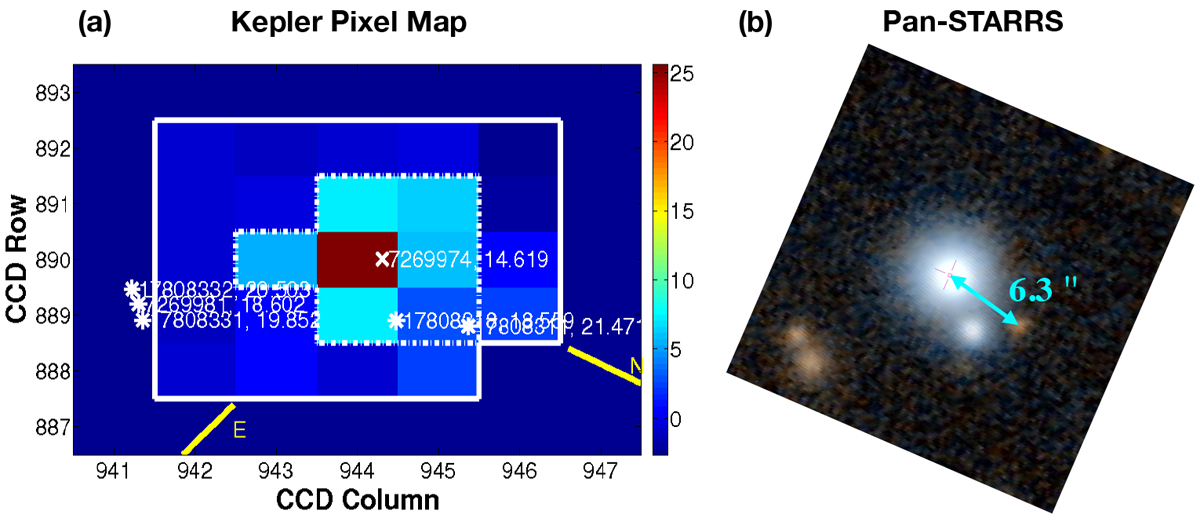
Panel a: Kepler CCD photometry of Kepler-160 from the Data Validation Report. The dotted line outlines the aperture mask used to extract the light curve. The cross denotes the target position, and the stars (with annotated KIC numbers) indicate the positions of stars that might act as contaminants of the target light curve. The color scale illustrates the difference between mean flux out-of-transit and in-transit of Kepler-160 b (KOI-456.01) after normalizing by the uncertainty in the difference for each pixel. North and east are indicated with yellow lines. The Kepler CCD pixels are squares and appear stretched in this figure from the Data Validation Report. Panel b: Pan-STARRS image that shows Kepler-160 in the center. The imageis properly oriented so that north coincides with the Kepler image in panel a. The distance of 6.3′′ to one nearby star is indicated with an arrow.
Current usage metrics show cumulative count of Article Views (full-text article views including HTML views, PDF and ePub downloads, according to the available data) and Abstracts Views on Vision4Press platform.
Data correspond to usage on the plateform after 2015. The current usage metrics is available 48-96 hours after online publication and is updated daily on week days.
Initial download of the metrics may take a while.