Free Access
Fig. 7.
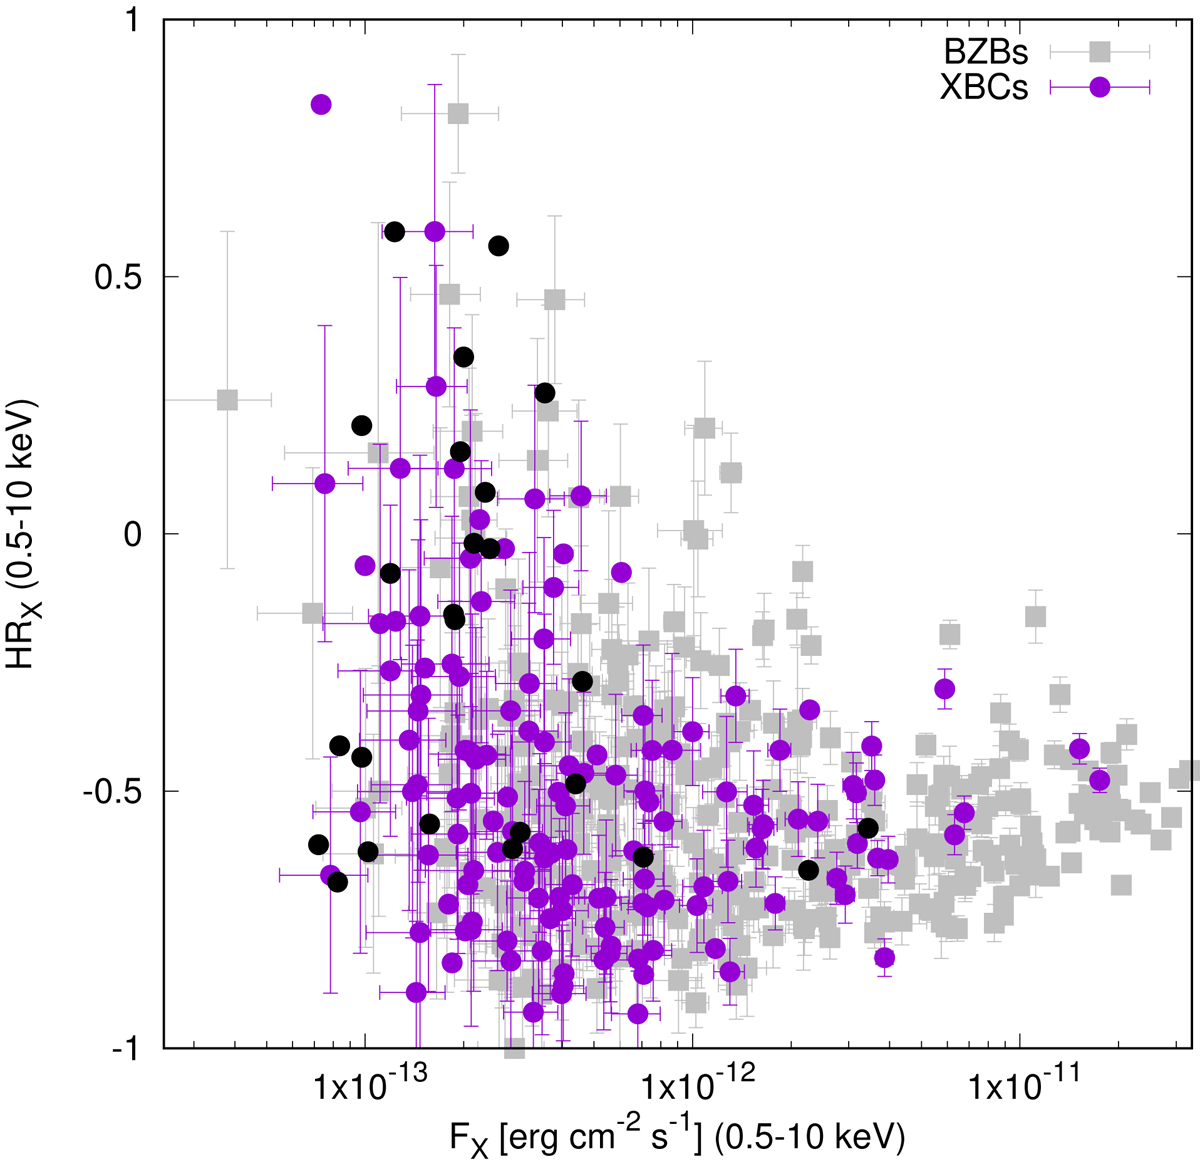
HRX versus FX in the 0.5−10 keV band for all sources in the XBC sample. XBCs are plotted in empty purple circles, while Fermi BZBs are plotted in grey filled squares. When two XBCs lie within the positional uncertainty area of the same UGS, the most distant one is marked with filled black circles.
Current usage metrics show cumulative count of Article Views (full-text article views including HTML views, PDF and ePub downloads, according to the available data) and Abstracts Views on Vision4Press platform.
Data correspond to usage on the plateform after 2015. The current usage metrics is available 48-96 hours after online publication and is updated daily on week days.
Initial download of the metrics may take a while.