Fig. 14.
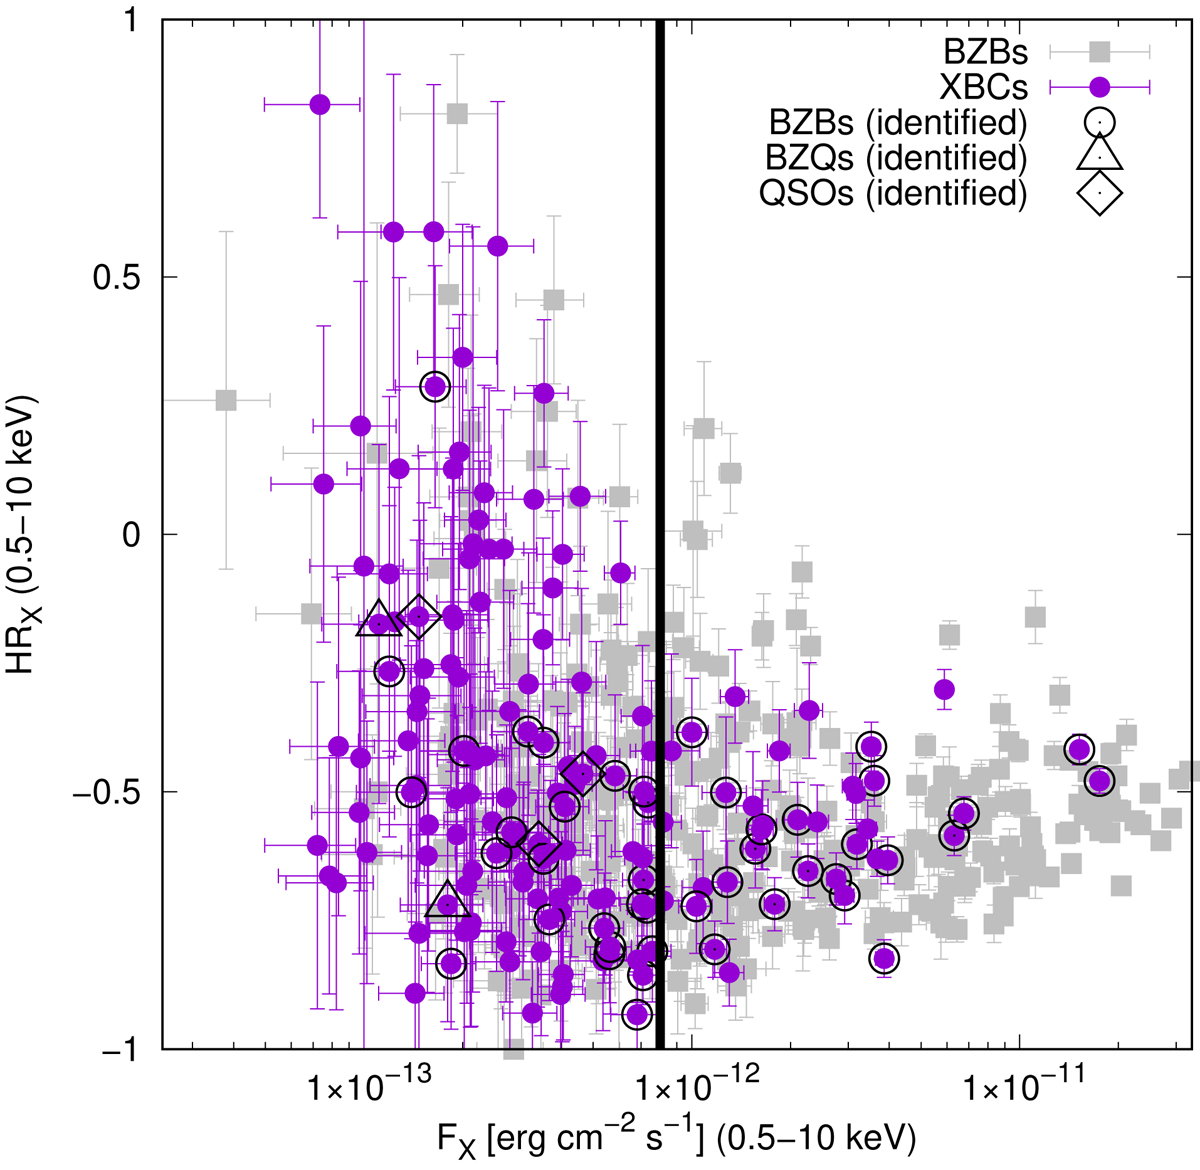
HRX for all the XBC sample vs. FX in the 0.5−10 keV band. The symbol coding is the same as in Fig. 7. XBCs that have been classified as BZBs are plotted as empty black circles, while BZQs and QSOs as black triangles and diamonds, respectively. The solid black line represents a threshold in FX above which 68% of all XBCs have already been identified and only as BZBs.
Current usage metrics show cumulative count of Article Views (full-text article views including HTML views, PDF and ePub downloads, according to the available data) and Abstracts Views on Vision4Press platform.
Data correspond to usage on the plateform after 2015. The current usage metrics is available 48-96 hours after online publication and is updated daily on week days.
Initial download of the metrics may take a while.