Fig. 11.
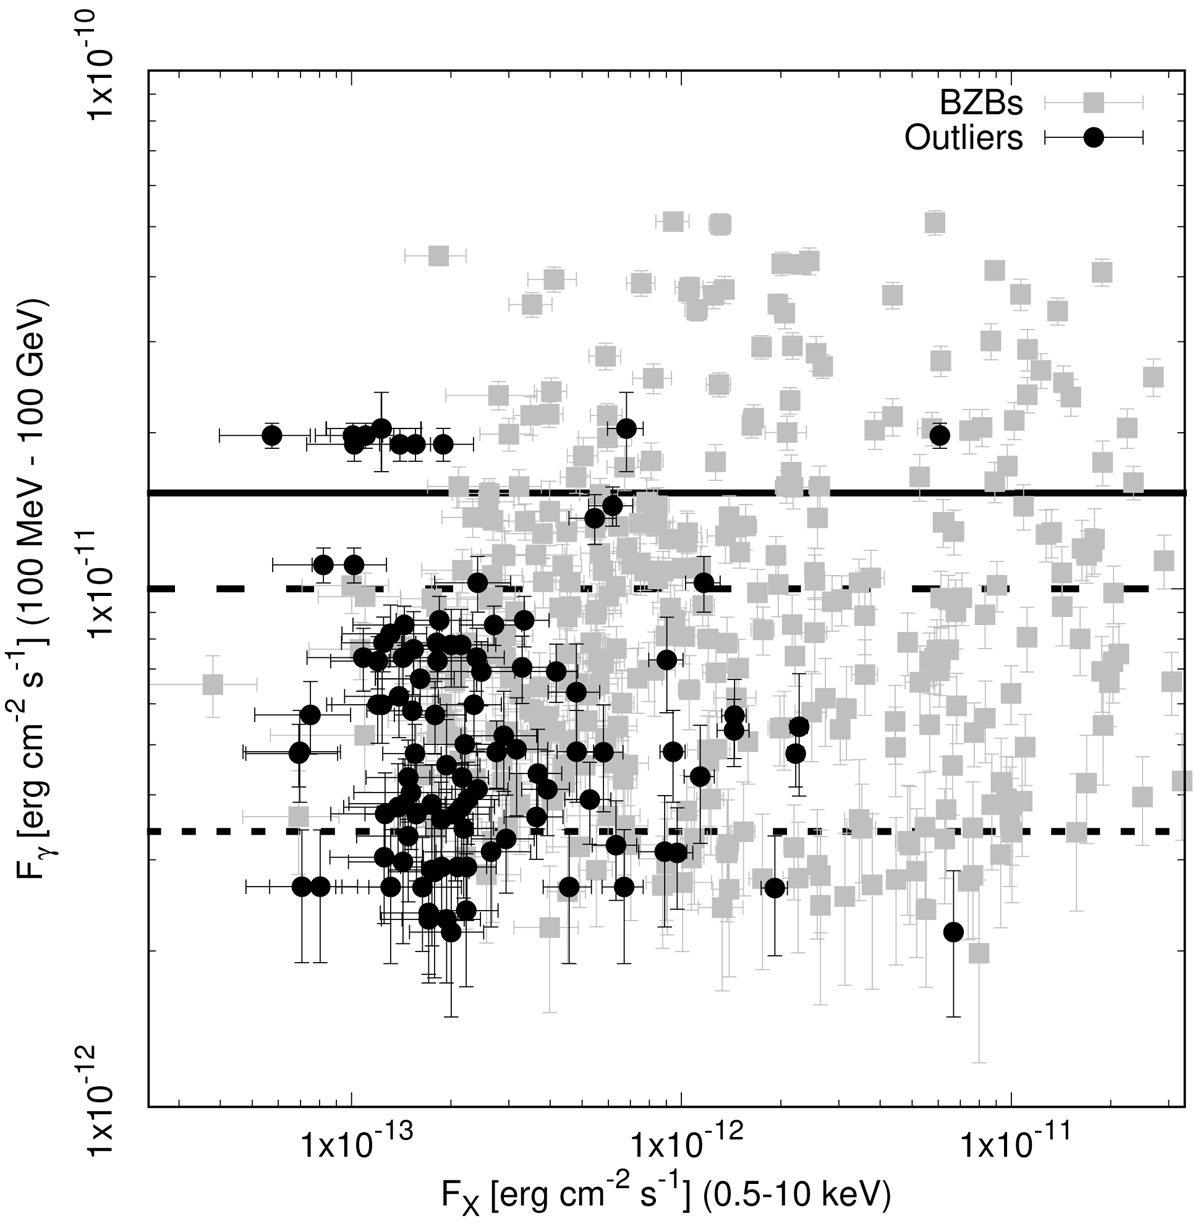
Fγ in the 100 MeV−100 GeV band vs. FX in the 0.5−10 keV band, from the Fermi 3FGL catalog, for all OUTs in our sample. The symbol coding is the same as in Fig. 10. The Fγ thresholds above which 100%, 98%, and 96% of the BZB sample would be detected in X-rays when their exposure times have been scaled down to 5 ks, are plotted in solid, dashed and dotted black lines, respectively.
Current usage metrics show cumulative count of Article Views (full-text article views including HTML views, PDF and ePub downloads, according to the available data) and Abstracts Views on Vision4Press platform.
Data correspond to usage on the plateform after 2015. The current usage metrics is available 48-96 hours after online publication and is updated daily on week days.
Initial download of the metrics may take a while.