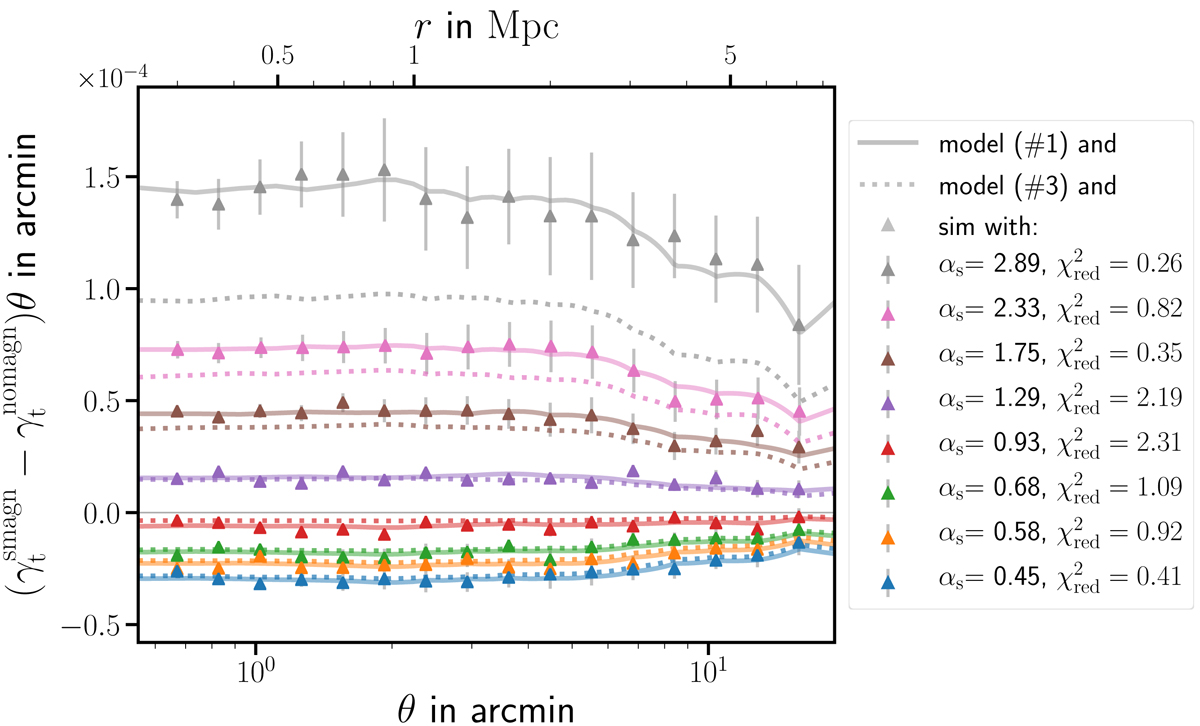
Fig. 3.

Absolute difference between shear profiles with and without magnification of sources, for different local slopes αs shown in the legend. The solid lines correspond to the first expression in Eq. (16) and dotted lines correspond to its approximation in the third line. The upper scale shows comoving transverse separation, and the redshifts are zs = 0.99 for the sources and zd = 0.41 for the lenses. The brown triangles with αs = 1.75 and the orange ones αs = 0.58 are directly comparable to the orange triangles in the upper panels of Fig. 2. We also show the goodness-of-fit parameter ![]() with 16 degrees of freedom for the solid line.
with 16 degrees of freedom for the solid line.
Current usage metrics show cumulative count of Article Views (full-text article views including HTML views, PDF and ePub downloads, according to the available data) and Abstracts Views on Vision4Press platform.
Data correspond to usage on the plateform after 2015. The current usage metrics is available 48-96 hours after online publication and is updated daily on week days.
Initial download of the metrics may take a while.


