Fig. 2.
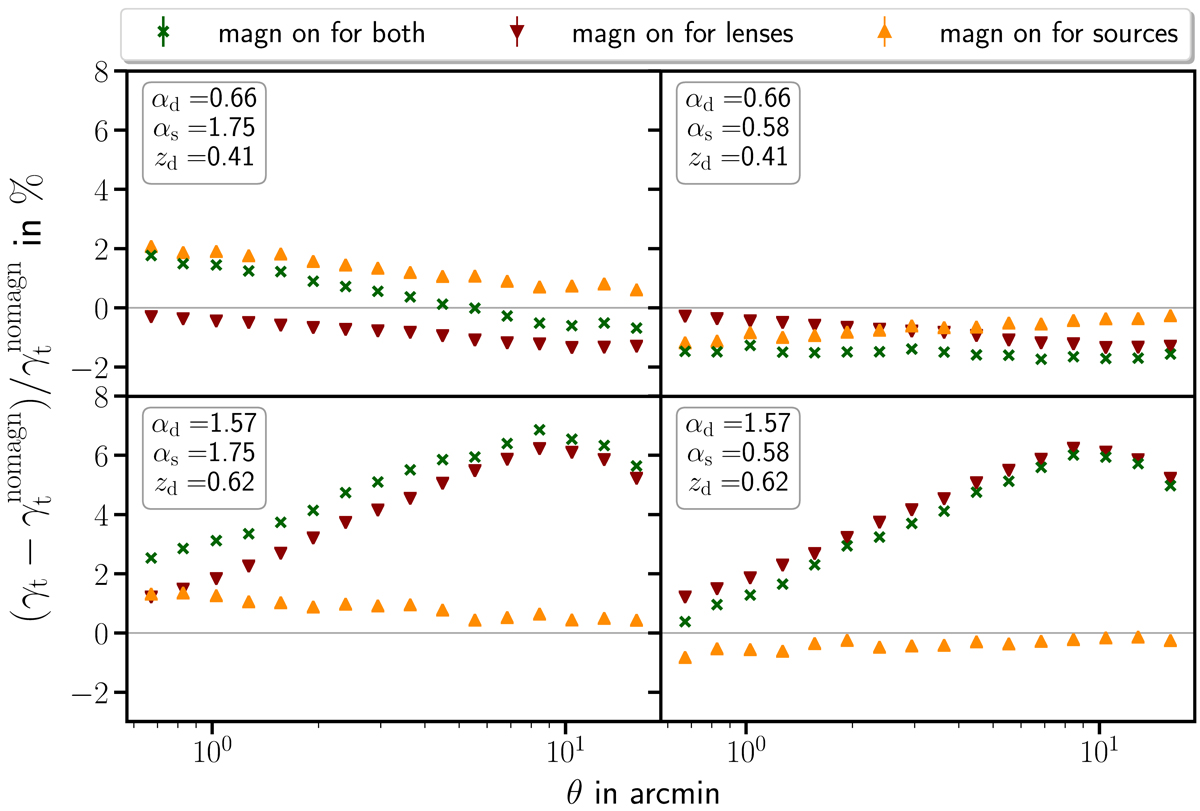
Relative difference between shear profiles with and without magnification. The redshifts for the lenses are zd = 0.41 in the upper panels and zd = 0.62 in the lower panels; the source redshift is kept fixed at zs = 0.99. The limiting magnitude of the lenses is 22 mag in the r-band, and for the sources it is 23 and 25 mag for αs = 1.75 and 0.58, respectively. The red “downward” triangles indicate shear profiles that only have magnification in the lens galaxy population, while the orange “upward” triangles show the influence of magnification for source galaxies only. It can be seen that a local slope > 1 of lens or source population leads to an enhanced signal, whereas αd, s < 1 causes a reduced signal. The green crosses display a measurement closest to real observations, i.e. where magnification affects both source and lens galaxy populations. A reduction or enhancement depends on both slopes αd, s, as well as the redshifts of lenses and sources zd, s. In all cases, the shape of the shear profile changes.
Current usage metrics show cumulative count of Article Views (full-text article views including HTML views, PDF and ePub downloads, according to the available data) and Abstracts Views on Vision4Press platform.
Data correspond to usage on the plateform after 2015. The current usage metrics is available 48-96 hours after online publication and is updated daily on week days.
Initial download of the metrics may take a while.