Fig. 12.
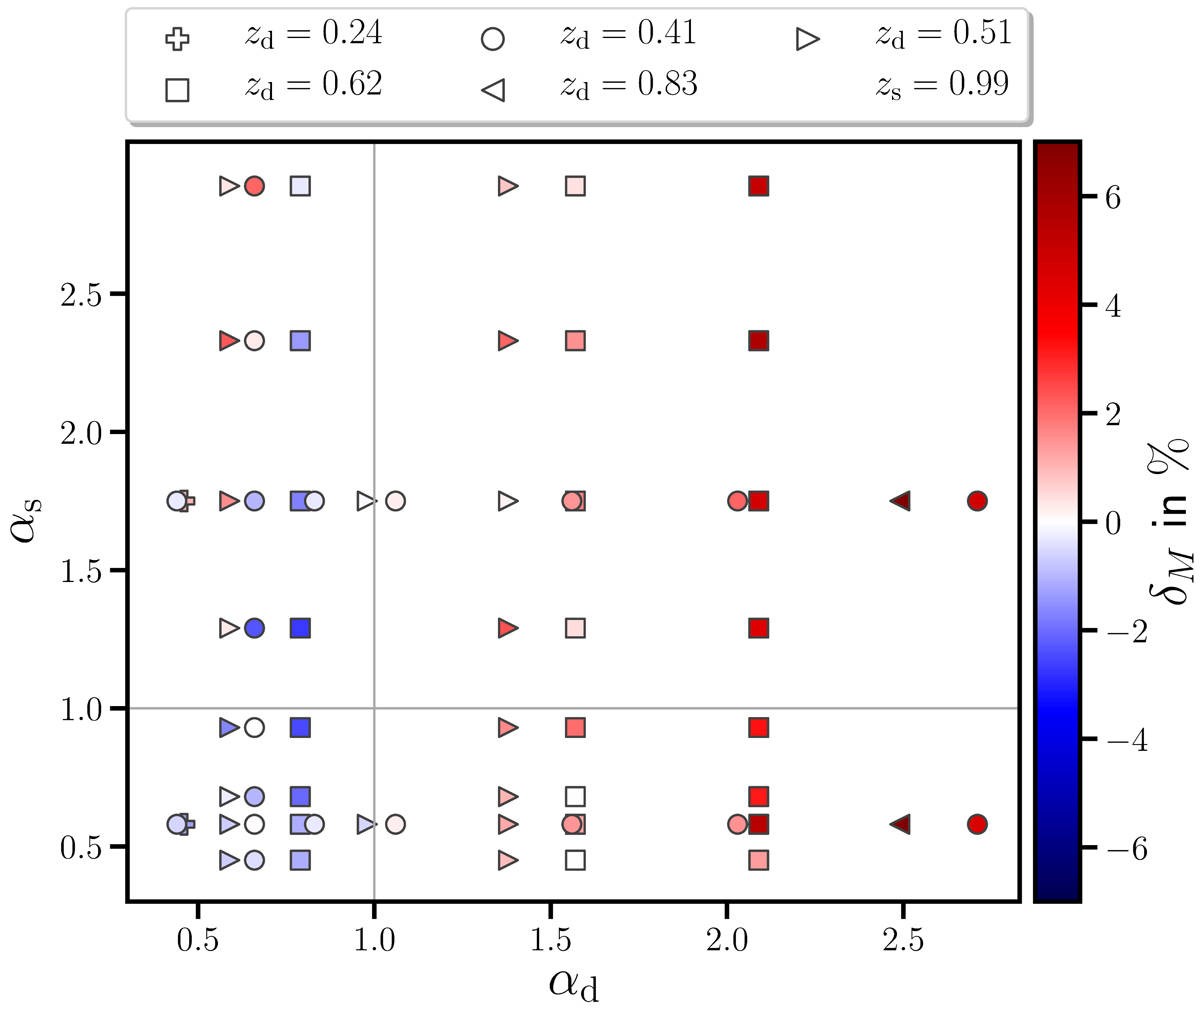
Total magnification bias for halo-mass estimates as a function of limiting magnitudes that yield the local slopes αd, s and lens redshift zd (type of symbols). The source redshift is the same in all cases, i.e., zs = 0.99. The mass difference δM is shown in colour code, where blue indicates underestimation, red overestimation, and white is an unbiased result. We cut off the colour bar for the largest deviations of 55% and 58% for αd = 2.41 and zd = 0.83 for higher contrast in the colour scale. The plot is roughly divided by the vertical line with αd = 1 into mass underestimation for αd < 1 and overestimation αd > 1.
Current usage metrics show cumulative count of Article Views (full-text article views including HTML views, PDF and ePub downloads, according to the available data) and Abstracts Views on Vision4Press platform.
Data correspond to usage on the plateform after 2015. The current usage metrics is available 48-96 hours after online publication and is updated daily on week days.
Initial download of the metrics may take a while.