Fig. 11.
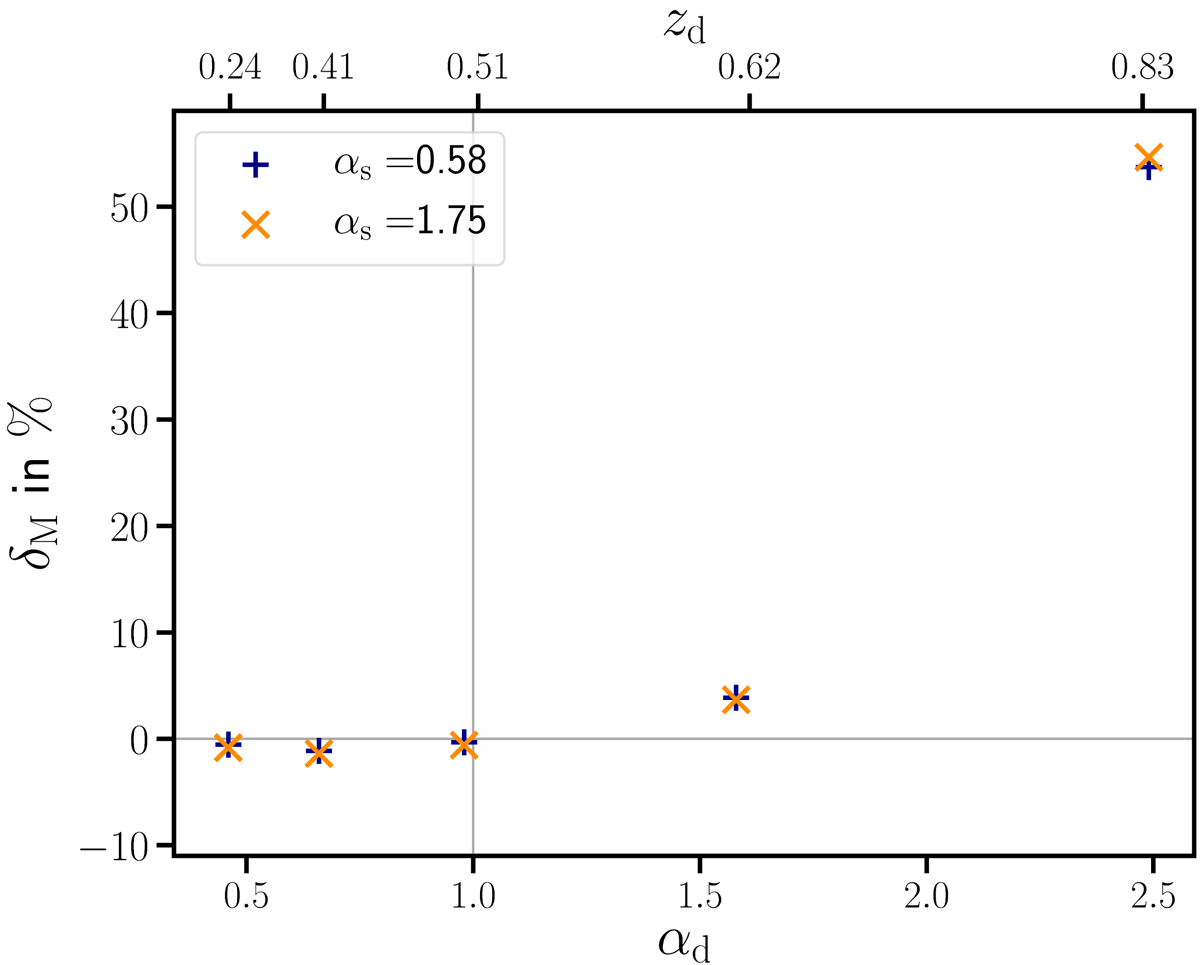
The fractional mass bias δM is shown as a function of local slope αd and lens redshift zd (cf. Table 1c). We keep the r-band limiting magnitude for the lenses and the source redshift zs = 0.99 constant. The top axis indicates the respective lens redshifts in a non-linear scaling. Following the trend seen in Fig. 7, mass is biased low for αd < 1 and shows large biases for αd > 1.
Current usage metrics show cumulative count of Article Views (full-text article views including HTML views, PDF and ePub downloads, according to the available data) and Abstracts Views on Vision4Press platform.
Data correspond to usage on the plateform after 2015. The current usage metrics is available 48-96 hours after online publication and is updated daily on week days.
Initial download of the metrics may take a while.