Fig. 7
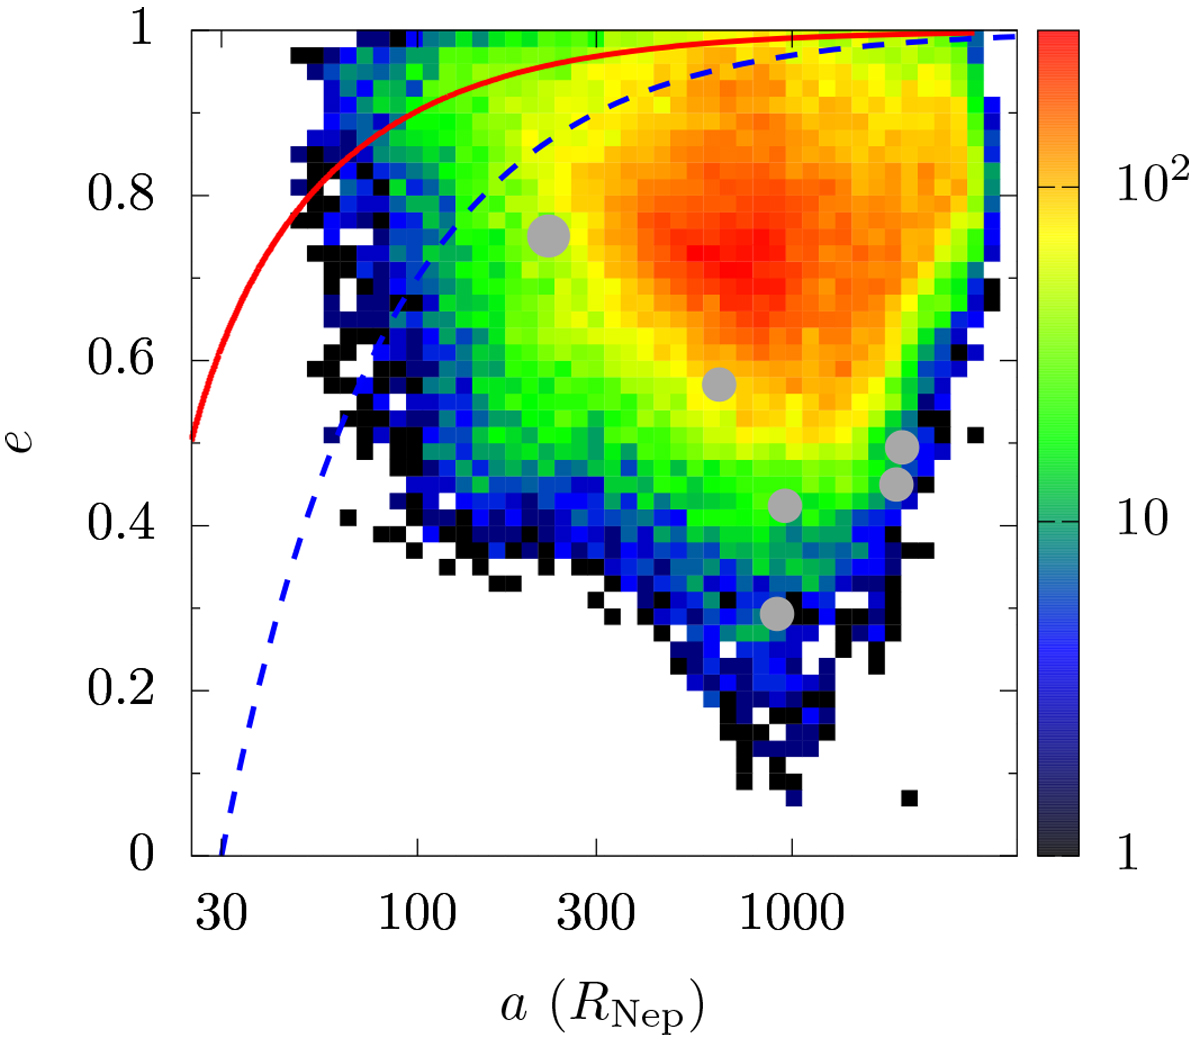
Distribution of (a, e) of the orbits of the captured moons from the outer moon region of IG18 at the encounter distance of qenc = 0.003 au. Warmer colours mean higher numbers and grey dots are the observed satellite; cf. Fig. 1. The red solid line marks atidal circularisation isochrone of 4 Gyr; the blue (short-)dashed line represents an equal pericentre distance q = 30 RNep; cf. Fig. 2.
Current usage metrics show cumulative count of Article Views (full-text article views including HTML views, PDF and ePub downloads, according to the available data) and Abstracts Views on Vision4Press platform.
Data correspond to usage on the plateform after 2015. The current usage metrics is available 48-96 hours after online publication and is updated daily on week days.
Initial download of the metrics may take a while.