Fig. 6
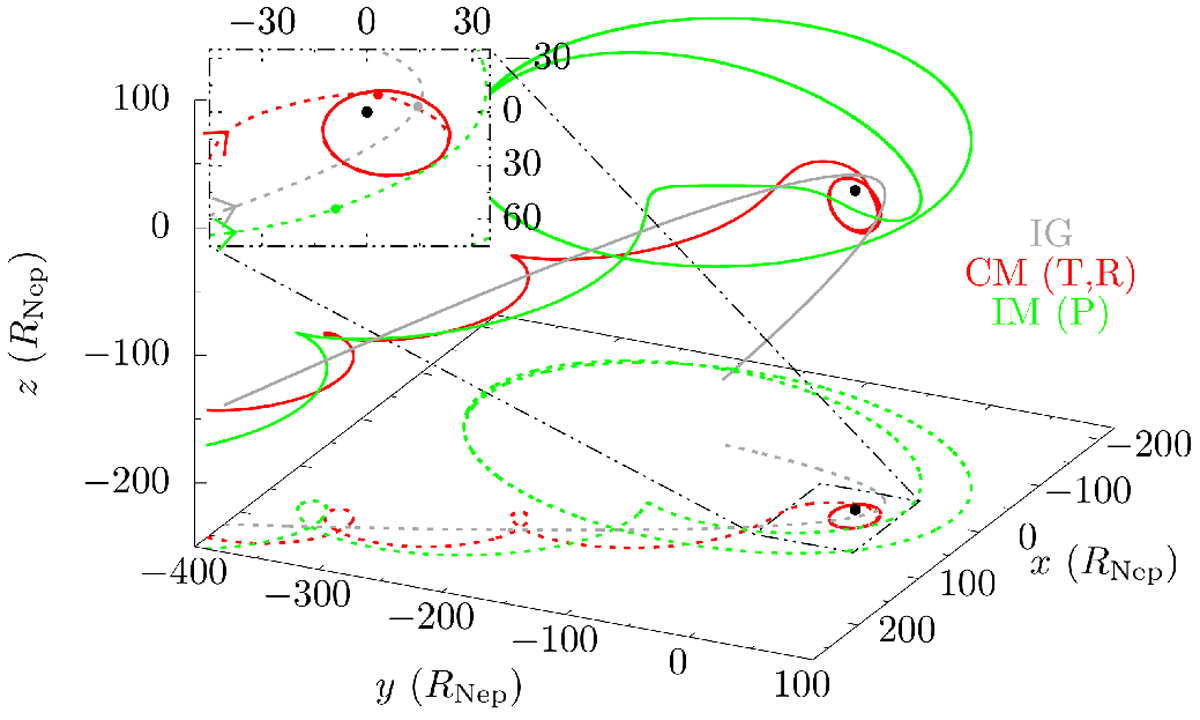
Trajectories of two moons captured by Neptune and of the ice giant (IG) during the encounter of the two planets. Neptune is the black dot at the origin. The grey line represents the path of the IG at qenc = 0.003 au, red that of a retrograde circularisable (by tides only) moon [CM (T,R)], and green that of a prograde irregular moon [IM (P)]. Both moons are initially orbiting the IG, entering the plotted area from the bottom left, and then captured by Neptune. The projections onto the x-y plane (dotted lines) are also shown with a zoomed-in view in the top left corner of the plot where the dots show the positions of the objects at the closest approach of the two planets and the arrows the directions of motion.
Current usage metrics show cumulative count of Article Views (full-text article views including HTML views, PDF and ePub downloads, according to the available data) and Abstracts Views on Vision4Press platform.
Data correspond to usage on the plateform after 2015. The current usage metrics is available 48-96 hours after online publication and is updated daily on week days.
Initial download of the metrics may take a while.