Fig. 5
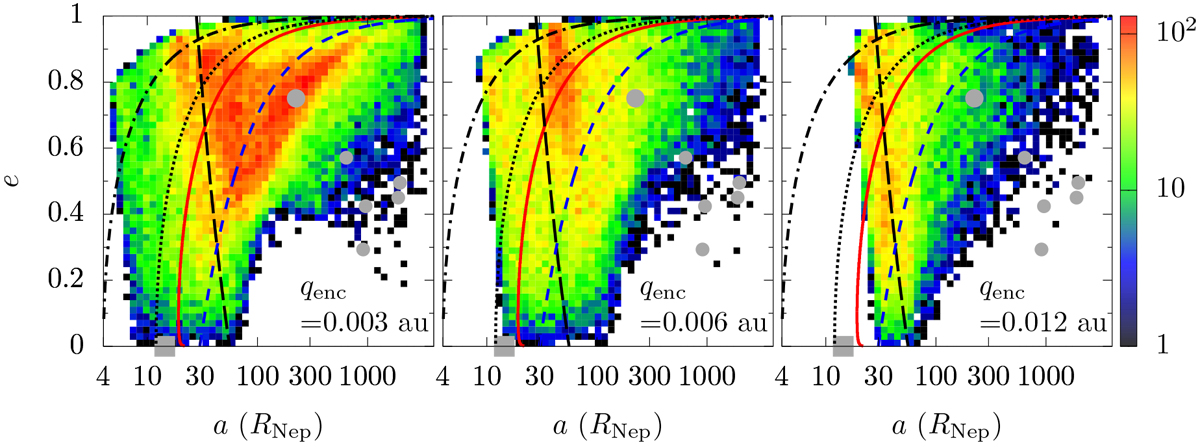
Distribution of (a, e) of the orbits of the captured moons from the inner moon region of IG18 at different encounter distances. The encounter distances are given in the bottom right corner of each panel. Warmer colours mean higher numbers, and grey dots are the observed satellite (cf. Fig. 1). The red solid line indicates a tidal circularisation isochrone of 4 Gyr; the blue short-dashed line represents an equal pericentre distance q = 30 RNep; the black long-dashed line delineates an equal apocentre distance of Nereid’s pericentre Q = qNer; and the dash-dotted and dotted lines show tidal engulfment limit for prograde and retrograde orbits, respectively (cf. Fig. 2).
Current usage metrics show cumulative count of Article Views (full-text article views including HTML views, PDF and ePub downloads, according to the available data) and Abstracts Views on Vision4Press platform.
Data correspond to usage on the plateform after 2015. The current usage metrics is available 48-96 hours after online publication and is updated daily on week days.
Initial download of the metrics may take a while.