Fig. 4
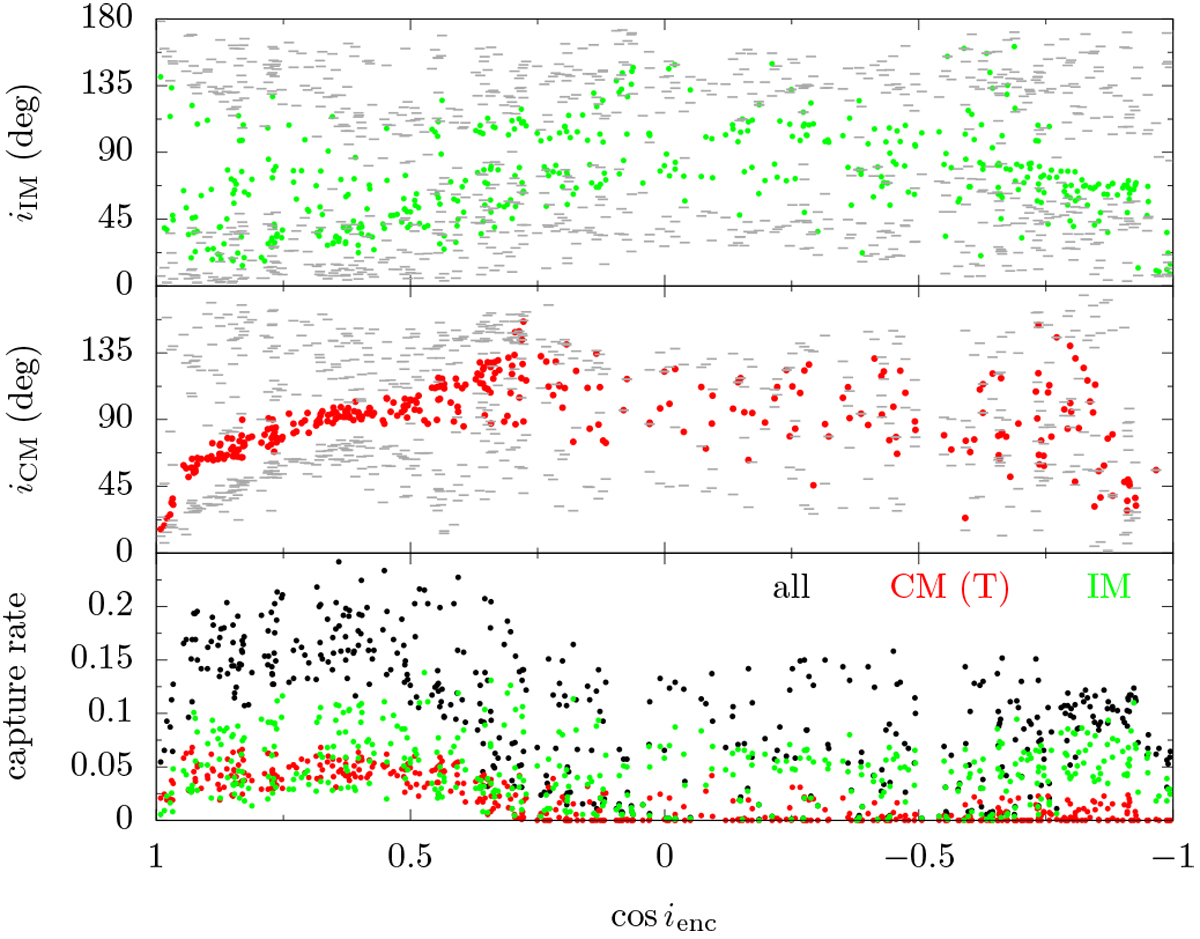
Inclination of captured moons and rate of capture for encounters of qenc = 0.003 au from the inner moon region around IG18. The bottom panel shows the capture rate for each encounter as a function of the inclination of that encounter: black dots for all captures (when integrated, this is the first entry of Table 2, Col. 3), red for circularisable moons through tides-only model, CM (T) (Col. 4), and green for irregular moons (IM, Col. 7). The middle panel shows the inclination distribution of the CM (T) captured during each encounter: coloured for the median and the lower and upper horizontal line segments the 5th and 95th percentiles. The top panel is the same as the middle, but for IM.
Current usage metrics show cumulative count of Article Views (full-text article views including HTML views, PDF and ePub downloads, according to the available data) and Abstracts Views on Vision4Press platform.
Data correspond to usage on the plateform after 2015. The current usage metrics is available 48-96 hours after online publication and is updated daily on week days.
Initial download of the metrics may take a while.