Fig. 15.
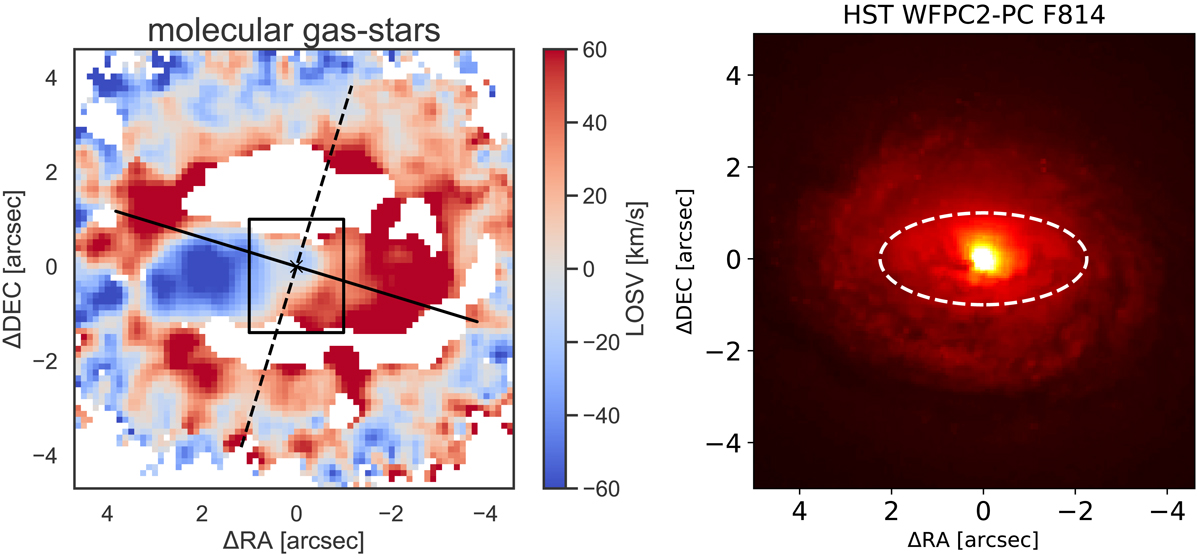
Left: residuals after subtraction of the stellar velocity field from the molecular gas (H2(1–0)S(1)) velocity field. The black solid and dashed lines show the line of nodes and the zero-velocity line of the stellar LOSV model, respectively. The black box indicates the central 1″, where Combes et al. (2019) report a torus with a radius of 21 pc ∼ 0.3″ in the centre using the CO(3–2) emission. Right: map of HST F814W to compare the residual velocities with dust lanes, with which inflowing motions are often associated. North is up and east is to the left.
Current usage metrics show cumulative count of Article Views (full-text article views including HTML views, PDF and ePub downloads, according to the available data) and Abstracts Views on Vision4Press platform.
Data correspond to usage on the plateform after 2015. The current usage metrics is available 48-96 hours after online publication and is updated daily on week days.
Initial download of the metrics may take a while.