Fig. 13.
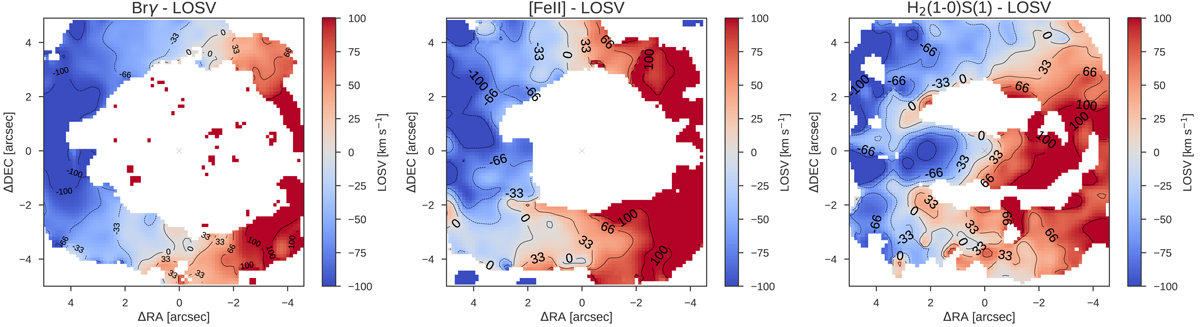
Gas LOSVs for Brγ, [Fe II]λ1.644 μm, and H2(1–0)S(1)λ2.122 μm. The black cross in the centre indicate the continuum flux peak. The white pixels show the clipped regions with low S/N, where line fit uncertainties are above 40%. All velocities are given relative to the systemic velocity of 1399 km s−1. North is up and east is to the left.
Current usage metrics show cumulative count of Article Views (full-text article views including HTML views, PDF and ePub downloads, according to the available data) and Abstracts Views on Vision4Press platform.
Data correspond to usage on the plateform after 2015. The current usage metrics is available 48-96 hours after online publication and is updated daily on week days.
Initial download of the metrics may take a while.