Fig. 9
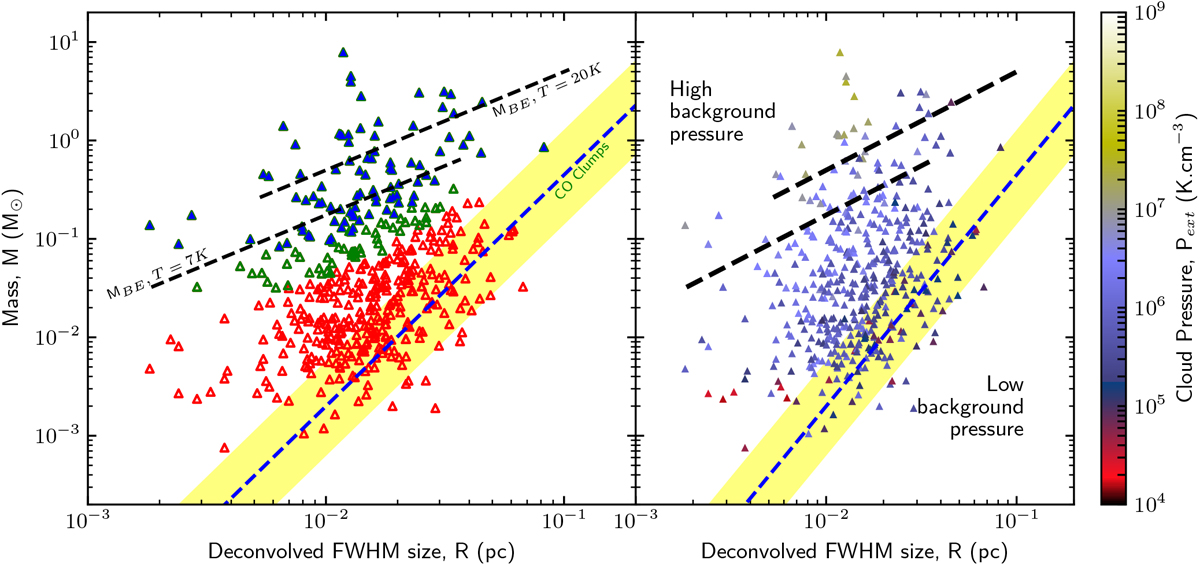
Left: mass versus size diagram for the entire population of 459 starless cores identified with Herschel in the Ophiuchus molecular cloud. The core FWHM sizes were measured with getsources in the high-resolution column density map (Fig. 2) and deconvolved from an 18′′ 2 (HPBW) Gaussian beam. The core masses were derived via graybody fitting to the getsources-estimated fluxes (see text). The 93 robust prestellar cores (for which αBE ≤ 2) are shown as filled blue symbols, the other (candidate) prestellar cores as open green symbols, and the other (unbound) starless cores as open red symbols. For comparison, models of critical isothermal Bonnor-Ebert spheres at T = 7 K and T = 20 K areplotted as dashed black lines. The mass-size correlation observed for diffuse CO clumps (cf. Elmegreen & Falgarone 1996) is displayed as a shaded yellow band. Right: same mass versus size diagram for all 459 starless cores, where the color coding of the data points is related to the ambient cloud pressure,
![]() , estimated from the local background column density Σcl
assuming a cloud in virial equilibrium (McKee & Tan 2003).
, estimated from the local background column density Σcl
assuming a cloud in virial equilibrium (McKee & Tan 2003).
Current usage metrics show cumulative count of Article Views (full-text article views including HTML views, PDF and ePub downloads, according to the available data) and Abstracts Views on Vision4Press platform.
Data correspond to usage on the plateform after 2015. The current usage metrics is available 48-96 hours after online publication and is updated daily on week days.
Initial download of the metrics may take a while.