Fig. 7
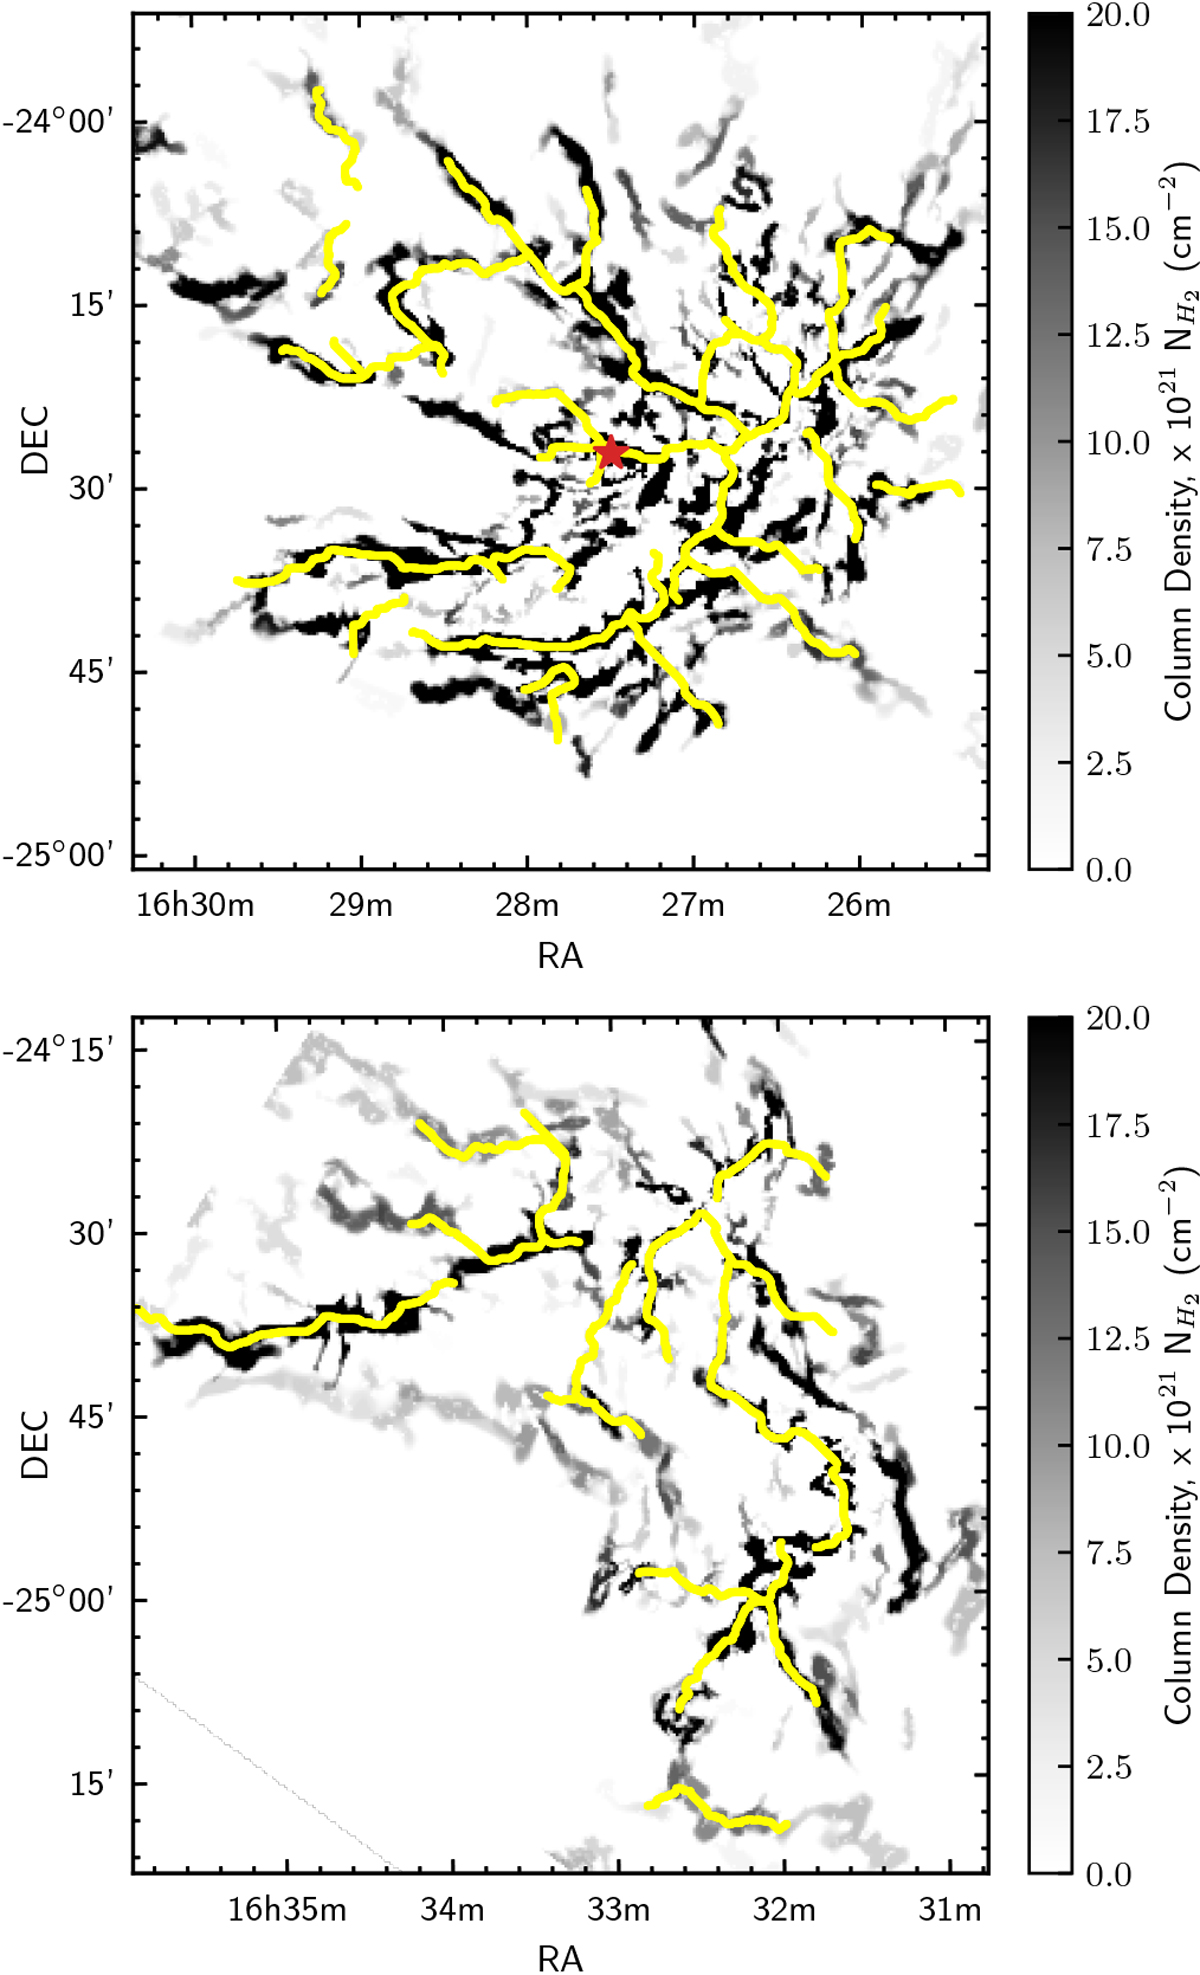
Filtered versions of the Herschel column density maps of L1688 (top) and L1689 (bottom), where the contrast of filamentary structures has been enhanced by accumulating small-scale emission up to a transverse scale of 150′′ (~ 0.1 pc) using the getfilaments algorithm (see Sect. 4.3). The grayscale represents effective column density within the skeleton masks generated by getfilaments. The skeleton of the filaments independently extracted with the DisPerSE algorithm is displayed in yellow. Top panel: the red star marks the center of mass of L1688.
Current usage metrics show cumulative count of Article Views (full-text article views including HTML views, PDF and ePub downloads, according to the available data) and Abstracts Views on Vision4Press platform.
Data correspond to usage on the plateform after 2015. The current usage metrics is available 48-96 hours after online publication and is updated daily on week days.
Initial download of the metrics may take a while.