Fig. 6
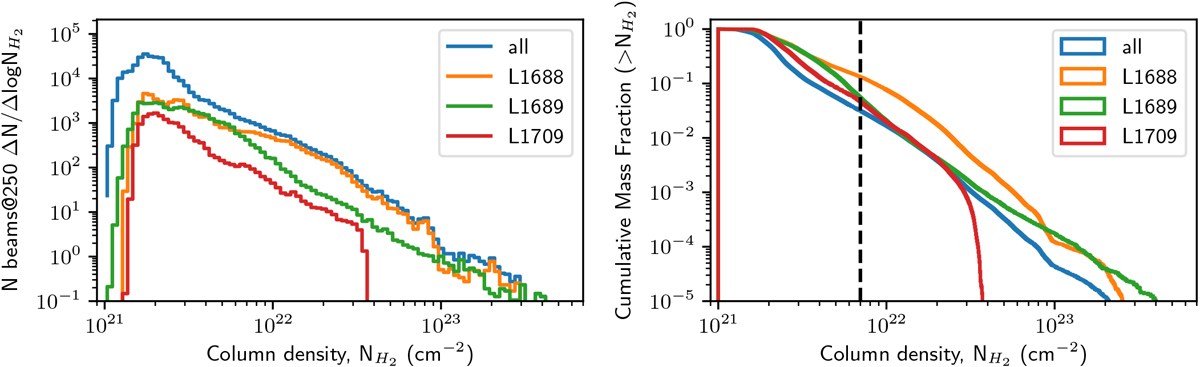
Left: probability density function (PDF) of column density in the Ophiuchus molecular cloud and its subclouds L1688, L1689 and L1709, as derived from the high-resolution column density map at a resolution of 18′′2. (See Table 2 for the results of power-law fits to the high-column density tails of the PDF.) The PDF of L1688 shows an overdensity around
![]() , probably as a consequence of the Sco OB2 influence. Right: normalized cumulative mass fraction as function of column density for the Ophiuchus molecular cloud using the same column-density map as in the top figure. The dashed line represents the fiducial dividing line between dense star-forming gas and lower-density gas. In the various parts of the cloud, the vast majority of the gas is found at low column density (AV
≤ 2).
, probably as a consequence of the Sco OB2 influence. Right: normalized cumulative mass fraction as function of column density for the Ophiuchus molecular cloud using the same column-density map as in the top figure. The dashed line represents the fiducial dividing line between dense star-forming gas and lower-density gas. In the various parts of the cloud, the vast majority of the gas is found at low column density (AV
≤ 2).
Current usage metrics show cumulative count of Article Views (full-text article views including HTML views, PDF and ePub downloads, according to the available data) and Abstracts Views on Vision4Press platform.
Data correspond to usage on the plateform after 2015. The current usage metrics is available 48-96 hours after online publication and is updated daily on week days.
Initial download of the metrics may take a while.