Fig. B.1
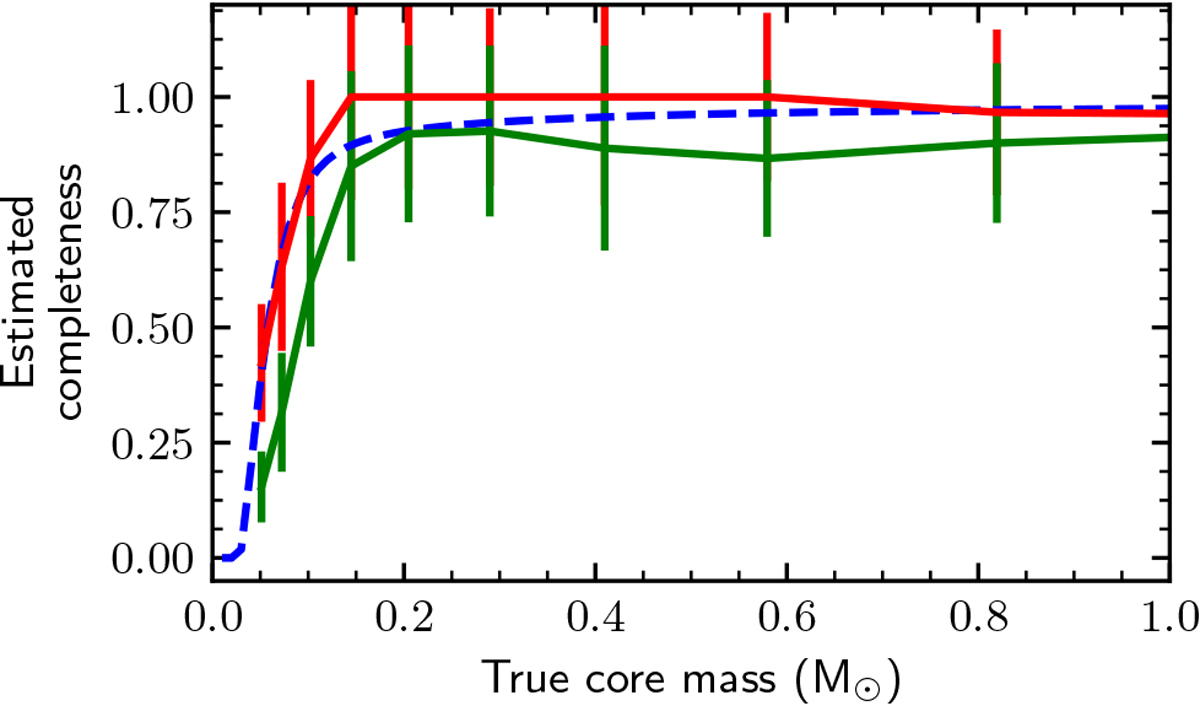
Completeness curves for our Herschel census of candidate prestellar cores based on Monte-Carlo simulations using a population of synthetic prestellar cores detected by getsources and classified as candidate prestellar cores (green solid curve) or classified as (bound or unbound) starless cores (red solid curve). For comparison, the dashed blue curve shows the completeness curve predicted by the simple model of the core extraction process described in Appendix B.2 of Könyves et al. (2015), scaled to the distance of the Ophiuchus cloud (d = 139 pc).
Current usage metrics show cumulative count of Article Views (full-text article views including HTML views, PDF and ePub downloads, according to the available data) and Abstracts Views on Vision4Press platform.
Data correspond to usage on the plateform after 2015. The current usage metrics is available 48-96 hours after online publication and is updated daily on week days.
Initial download of the metrics may take a while.