Fig. 19
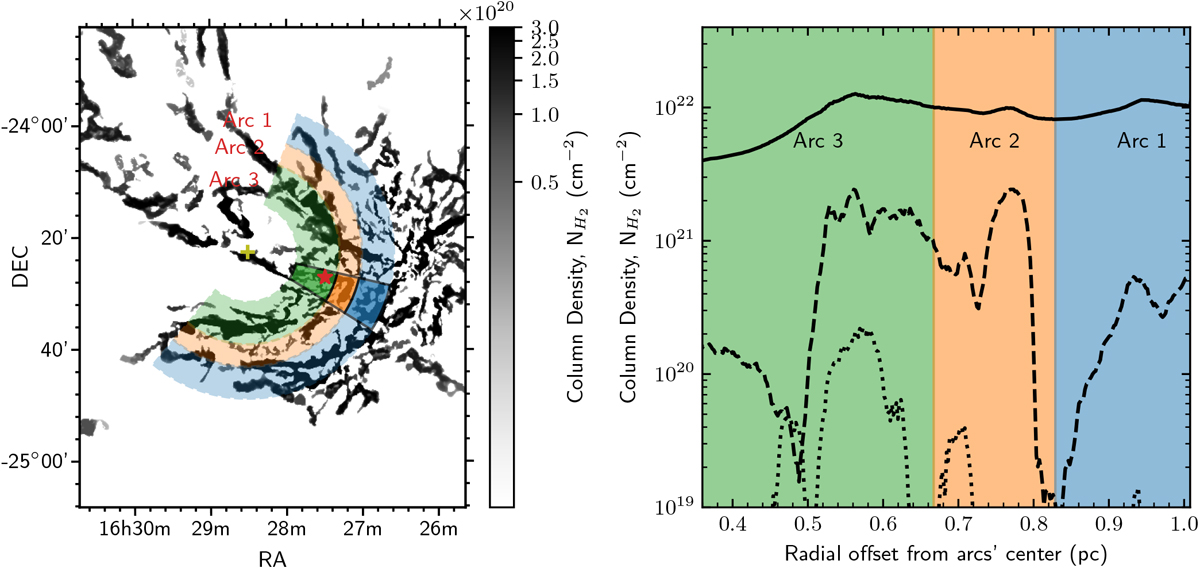
Left: filtered column density map of L1688 where concentric annuli associated with the shaded ranges are overplotted, each annulus marking the presence of one arc-like over-compression as seen in the right panel. Theyellow cross marks the center of the concentric annuli and the red star indicates the center of mass of L1688. Right: radial column density profile of the L1688 cloud, circularly averaged about a center close to Oph D. The shaded ranges highlight the three compression fronts seen in the column density image and associated with the three arcs in the left panel. The solid curve shows the profile obtained from an azimuthal average of the unfiltered column density map shown in Fig. 18 over the whole 190° of the shaded sectors in the left panel. The dashed curve shows the profile obtained from an azimuthal average of the filtered column density map over the same range of the shaded sectors in the left panel. The dotted line shows the profile averaged over the angles excluding the part around Oph B, outside of the two black solid lines in the left panel, with evidence of an overdensity highlighting the second arc (Arc 2).
Current usage metrics show cumulative count of Article Views (full-text article views including HTML views, PDF and ePub downloads, according to the available data) and Abstracts Views on Vision4Press platform.
Data correspond to usage on the plateform after 2015. The current usage metrics is available 48-96 hours after online publication and is updated daily on week days.
Initial download of the metrics may take a while.