Fig. 17
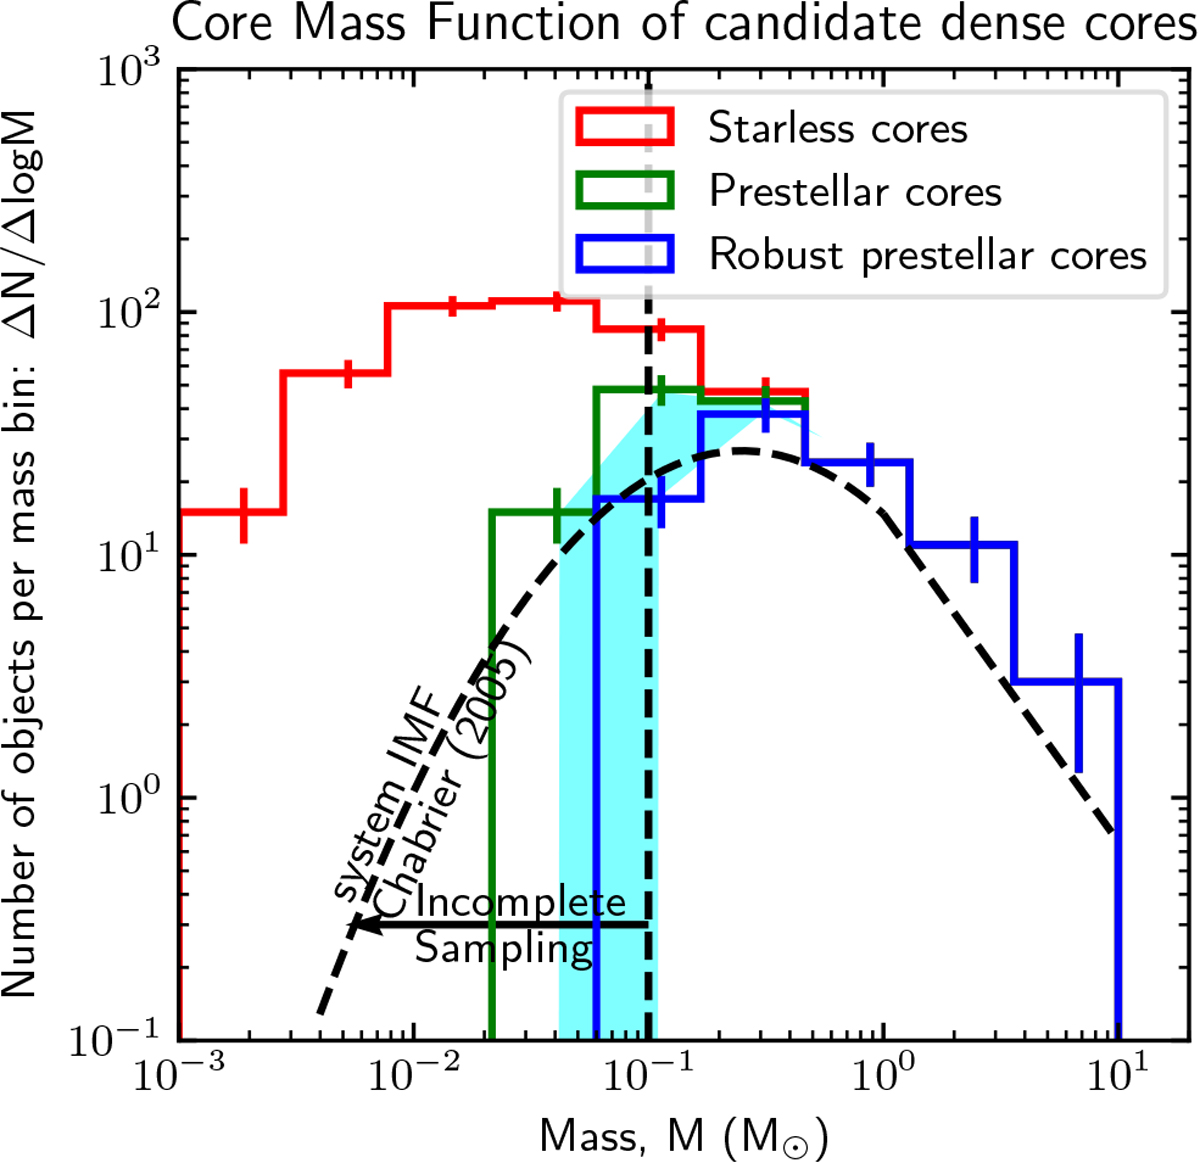
Mass distribution of robust prestellar cores (blue), candidate prestellar cores (green), and unbound starless cores (red). The cyan area marks the difference between robust and candidate prestellar cores. To left of the vertical dashed line, the sample of prestellar cores is less than 80% complete according to Monte-Carlo simulations (see Sect. 4.6 and Appendix B). For comparison, the black dashed curve shows the system IMF (Chabrier 2005).
Current usage metrics show cumulative count of Article Views (full-text article views including HTML views, PDF and ePub downloads, according to the available data) and Abstracts Views on Vision4Press platform.
Data correspond to usage on the plateform after 2015. The current usage metrics is available 48-96 hours after online publication and is updated daily on week days.
Initial download of the metrics may take a while.