Fig. 16
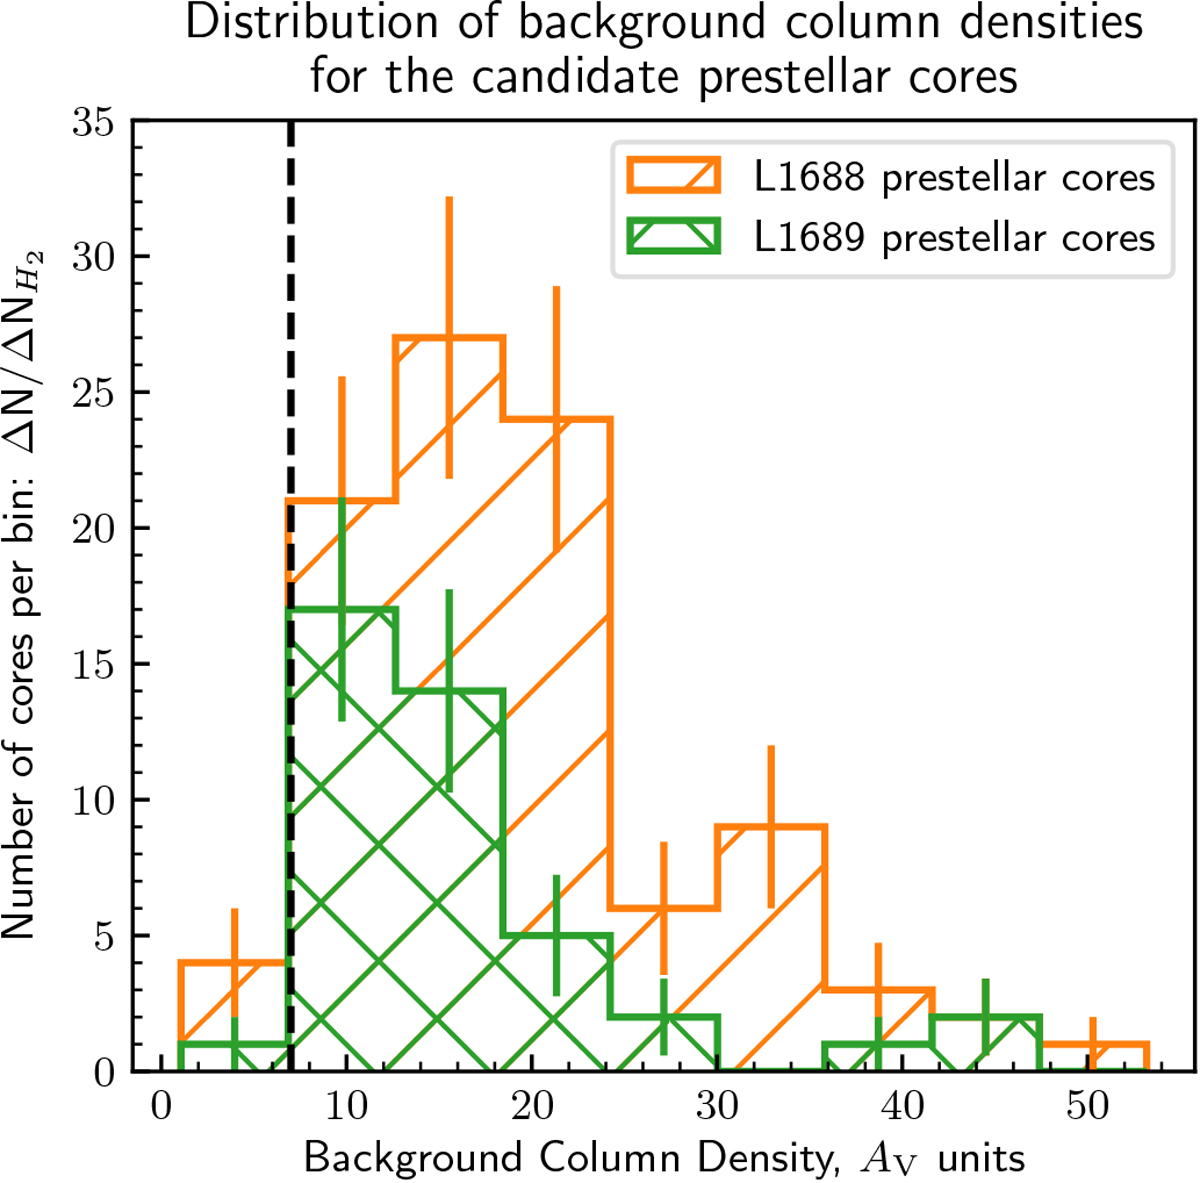
Distribution of background column densities for the L1688 (orange) and L1689 (green) prestellar cores. A clear peak in column density is visible, suggestive of a column-density threshold for prestellar core formation. However, this peak lies at a significantly higher column density in L1688 (orange) and in L1689 (green) than in other Gould Belt regionssuch as Aquila (cf. Könyves et al. 2015). The vertical dashed line marks the same fiducial threshold at
![]() as in Fig. 15.
as in Fig. 15.
Current usage metrics show cumulative count of Article Views (full-text article views including HTML views, PDF and ePub downloads, according to the available data) and Abstracts Views on Vision4Press platform.
Data correspond to usage on the plateform after 2015. The current usage metrics is available 48-96 hours after online publication and is updated daily on week days.
Initial download of the metrics may take a while.