Fig. 12
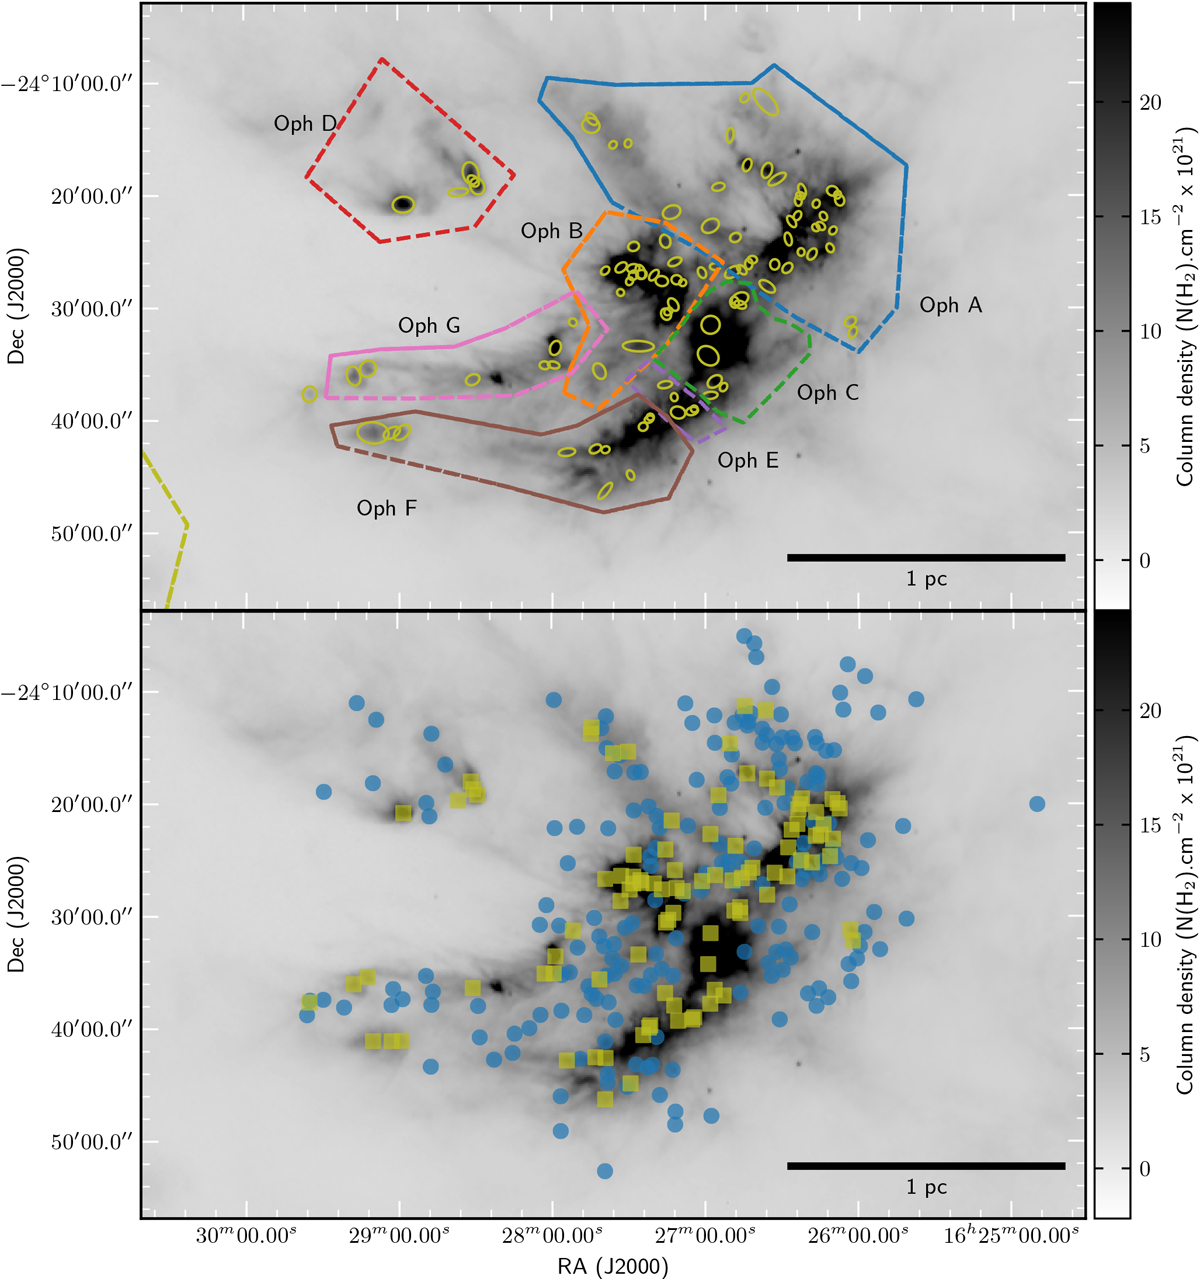
Top: spatial distribution of prestellar cores in L1688. The centroid positions, sizes, and position angles estimated with getsources for the prestellar and unbound cores in Table A.1 are represented by yellow ellipses overlaid on the Herschel high-resolution column density map derived from Herschel data (grayscale background image). Different colors are used for the separate dense clumps of L1688 (Oph A in blue, Oph B in orange, Oph C in green, Oph D in red, Oph E in purple, Oph F in brown, and Oph G in pink). Bottom: compared spatial distribution of prestellar cores (yellow squares) and unbound cores (blue circles) overlaid on the high resolution column-density map.
Current usage metrics show cumulative count of Article Views (full-text article views including HTML views, PDF and ePub downloads, according to the available data) and Abstracts Views on Vision4Press platform.
Data correspond to usage on the plateform after 2015. The current usage metrics is available 48-96 hours after online publication and is updated daily on week days.
Initial download of the metrics may take a while.