Fig. 11
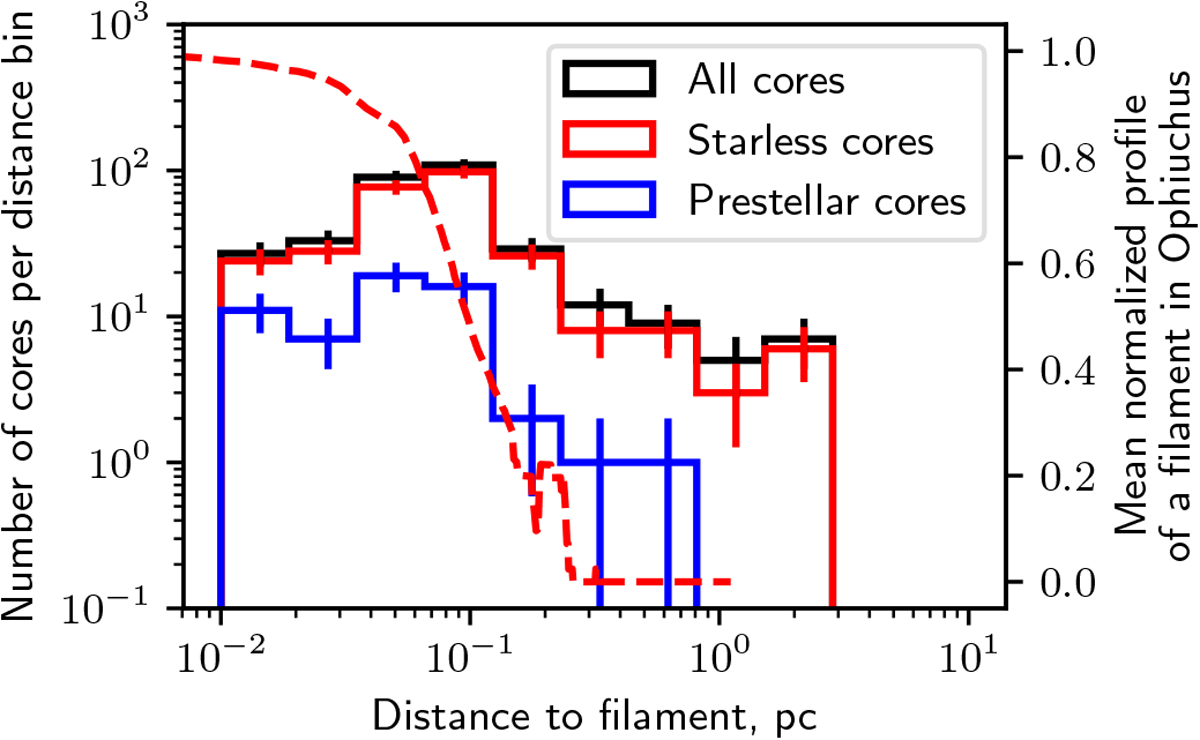
Distribution of core-to-filament separations in the Ophiuchus cloud, for both prestellar cores and (unbound) starless cores. For each core, the projected separation to the nearest filament in the sample of filamentary structures extracted with DisPerSE (cf. Sect. 4.3) was considered. For comparison, the red dashed curve shows an example of anormalized, crest-averaged radial column density profile for a filament traced with DisPerSE in Ophiuchus.
Current usage metrics show cumulative count of Article Views (full-text article views including HTML views, PDF and ePub downloads, according to the available data) and Abstracts Views on Vision4Press platform.
Data correspond to usage on the plateform after 2015. The current usage metrics is available 48-96 hours after online publication and is updated daily on week days.
Initial download of the metrics may take a while.