Fig. 1
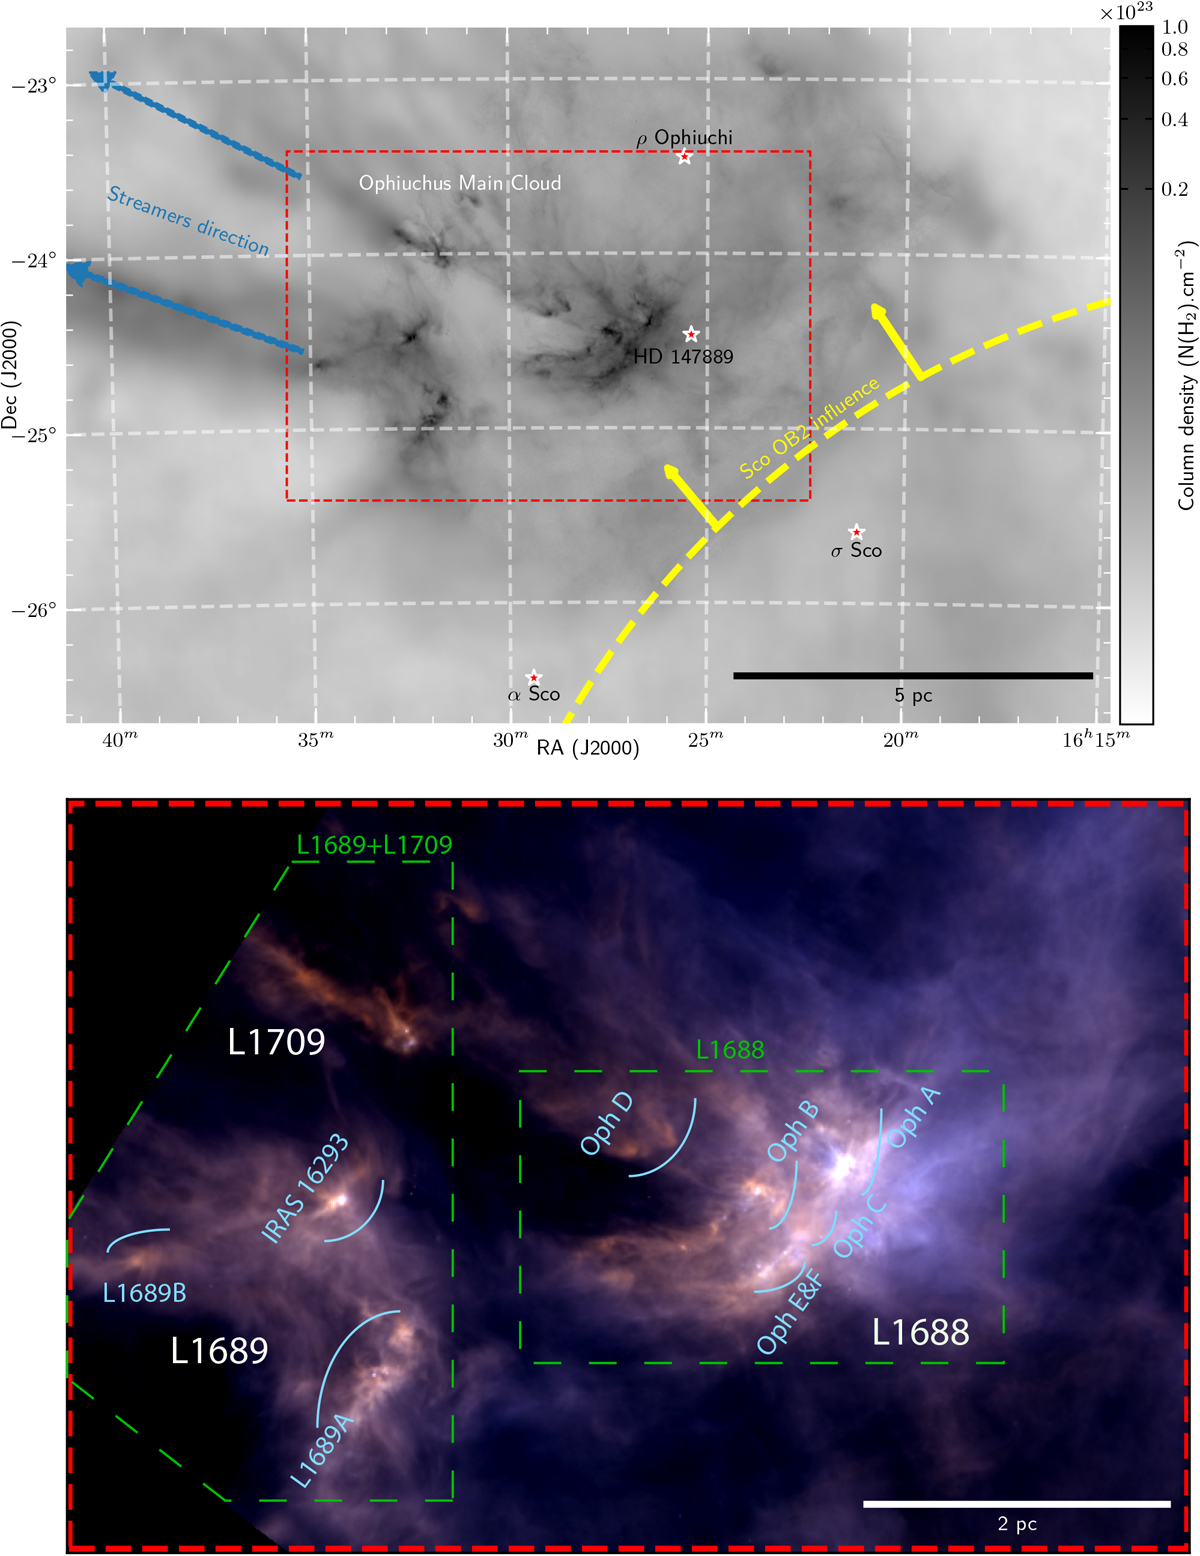
Top: multi-resolution column density map of the Ophiuchus complex derived from Planck/Herschel data (see text). The red rectangle shows the area encompassing the Ophiuchus main cloud covered by the Herschel data discussed in the paper. The effective resolution ranges from 18.2′′ in this area to 5′ in the outer parts. Bottom: composite three-color image of the field outlined by the red rectangle in the top panel, combining Herschel/PACS 160 μm data as a blue layer, Herschel/SPIRE 250 μm data as a green layer, and Herschel/SPIRE 350 μm data as a red layer. The main clumps and sub-regions of the field are marked. The green dashed polygons highlight the regions defined as L1688 and L1689+L1709 in the rest of the paper.
Current usage metrics show cumulative count of Article Views (full-text article views including HTML views, PDF and ePub downloads, according to the available data) and Abstracts Views on Vision4Press platform.
Data correspond to usage on the plateform after 2015. The current usage metrics is available 48-96 hours after online publication and is updated daily on week days.
Initial download of the metrics may take a while.