Free Access
Fig. 5
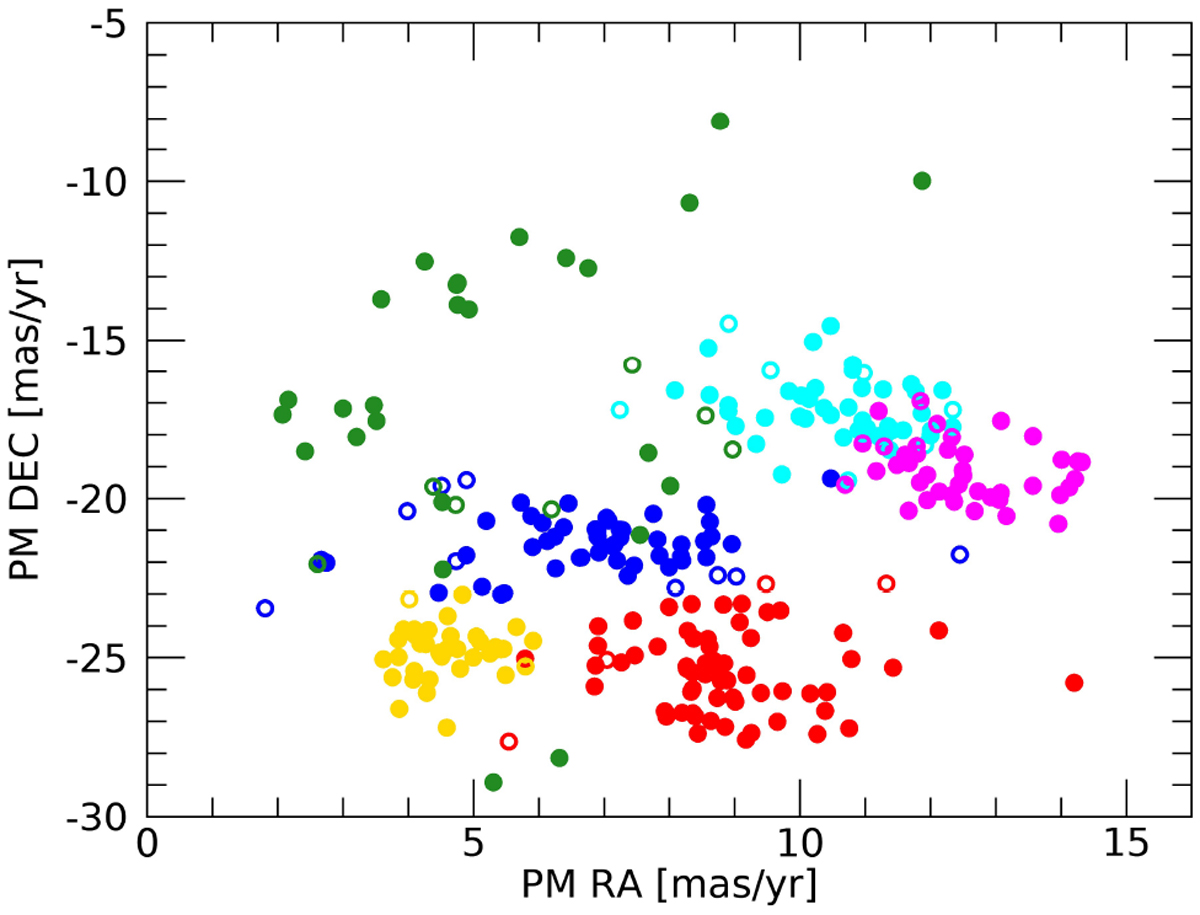
Proper motions in α and δ of the six populations, color coded as in Fig. 4. The filled dots represent sources with probabilities higher than 80%, while the empty circles represent sources with probabilities lower than 80%.
Current usage metrics show cumulative count of Article Views (full-text article views including HTML views, PDF and ePub downloads, according to the available data) and Abstracts Views on Vision4Press platform.
Data correspond to usage on the plateform after 2015. The current usage metrics is available 48-96 hours after online publication and is updated daily on week days.
Initial download of the metrics may take a while.