Fig. B.4
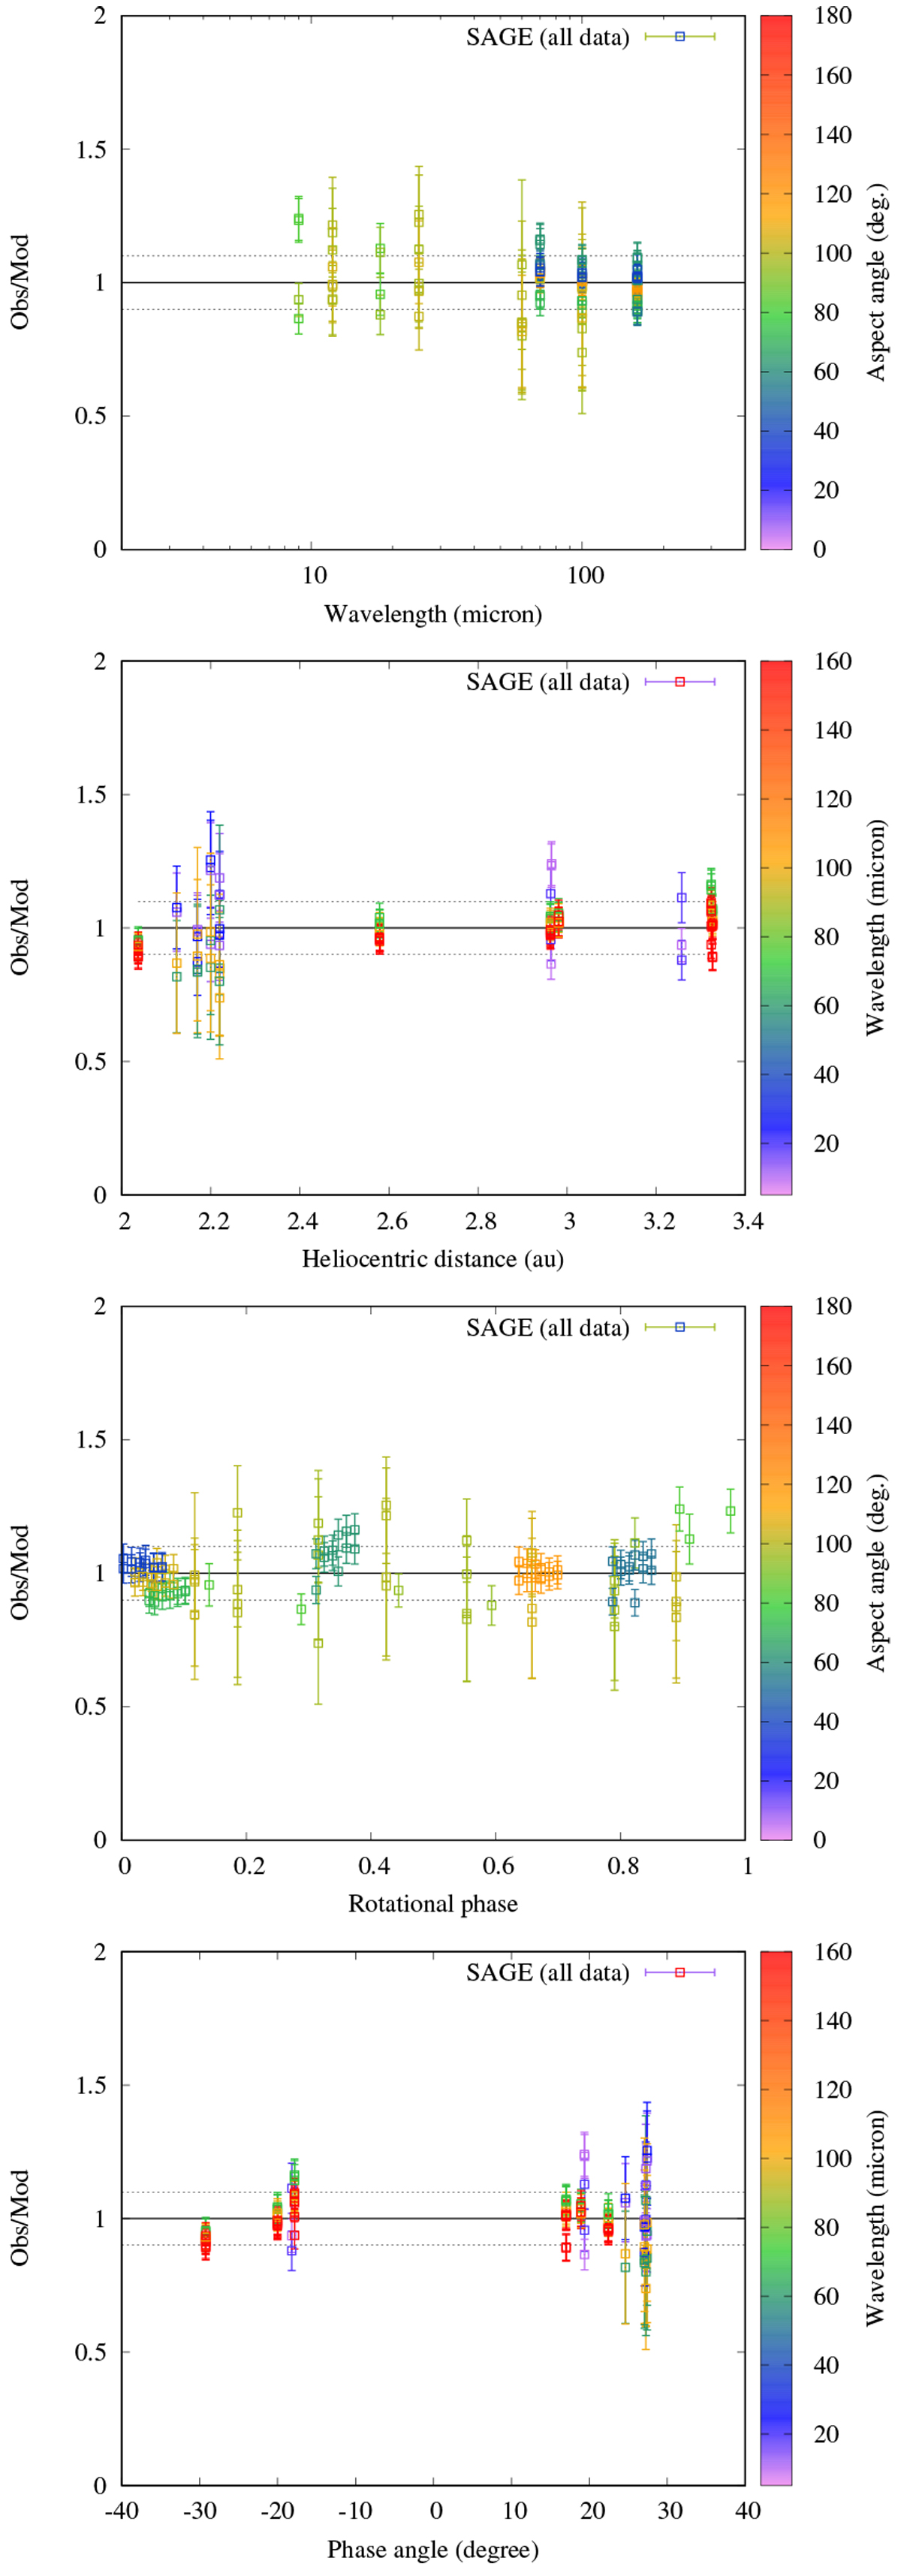
(3) Juno (from top to bottom): observation-to-model ratios versus wavelength, heliocentric distance, rotational phase, and phase angle. The color bar either corresponds to the aspect angle or to the wavelength at which each observation was taken. There are some systematics in the rotational phase plot, which indicate there could be some small artifacts in the shape.
Current usage metrics show cumulative count of Article Views (full-text article views including HTML views, PDF and ePub downloads, according to the available data) and Abstracts Views on Vision4Press platform.
Data correspond to usage on the plateform after 2015. The current usage metrics is available 48-96 hours after online publication and is updated daily on week days.
Initial download of the metrics may take a while.