Fig. A.1.
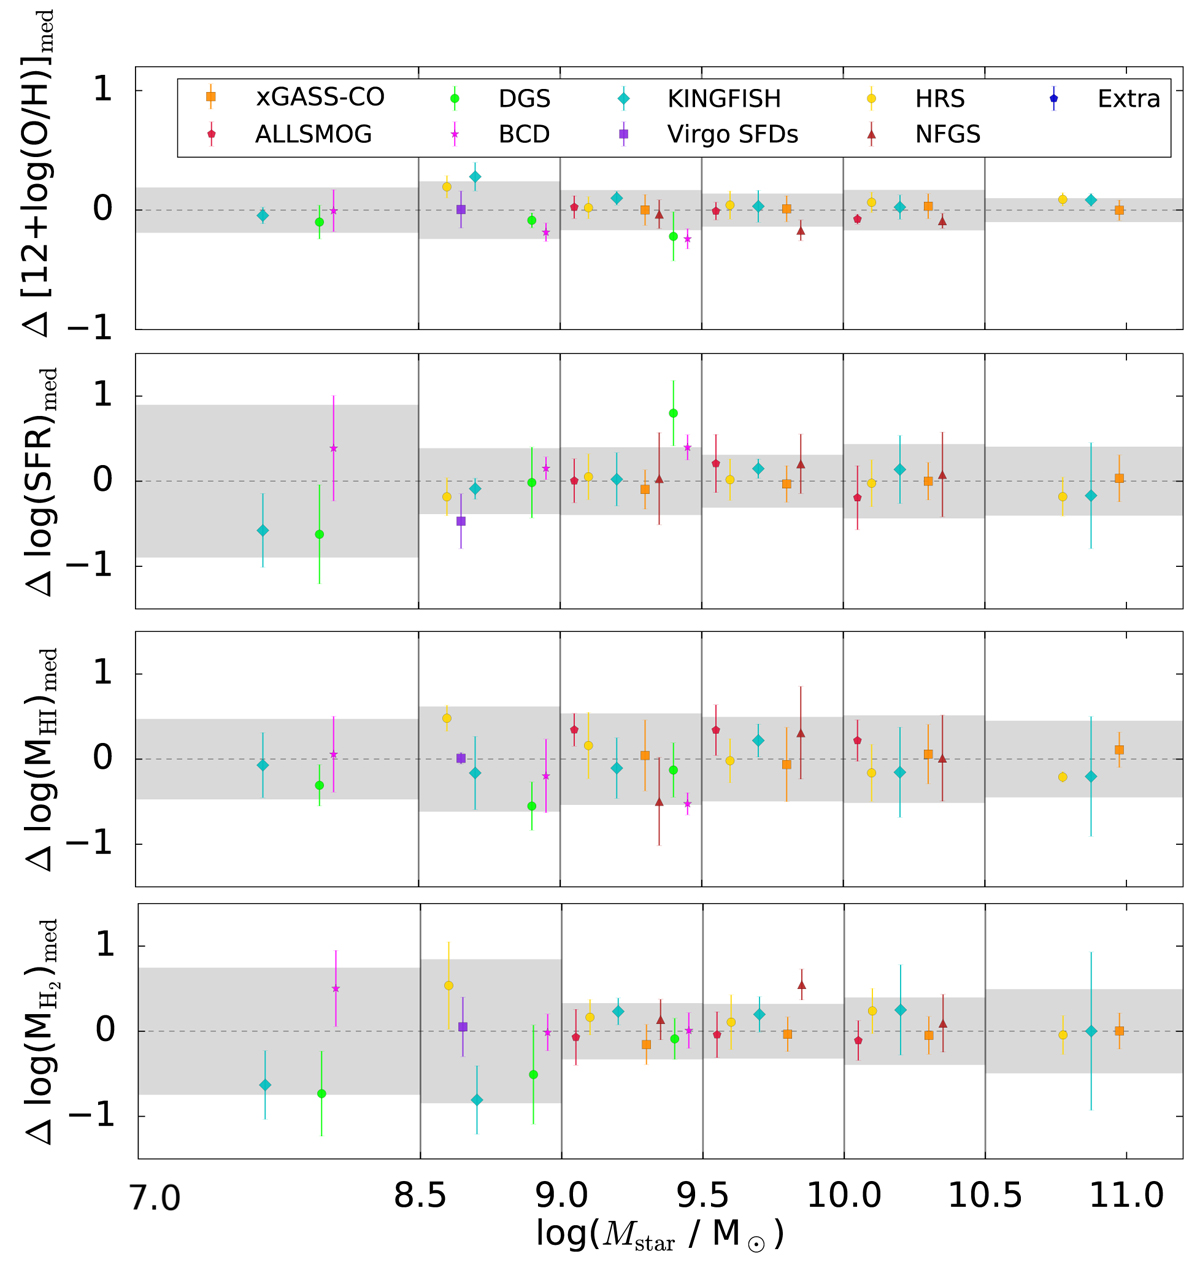
Comparison of SFR, 12 + log(O/H), MH2, and MHI in segregated Mstar bins for the MAGMA sample. The gray regions correspond to the standard deviations (±1σ), and the horizontal dashed line represents the zero difference (by definition) relative to the sample median. The nine different parent samples comprising MAGMA are shown by different symbols given in the legend in the upper right corner. The points and their error bars correspond to the median of the difference, relative to the median parameter of the MAGMA sample as a whole.
Current usage metrics show cumulative count of Article Views (full-text article views including HTML views, PDF and ePub downloads, according to the available data) and Abstracts Views on Vision4Press platform.
Data correspond to usage on the plateform after 2015. The current usage metrics is available 48-96 hours after online publication and is updated daily on week days.
Initial download of the metrics may take a while.