Fig. 7.
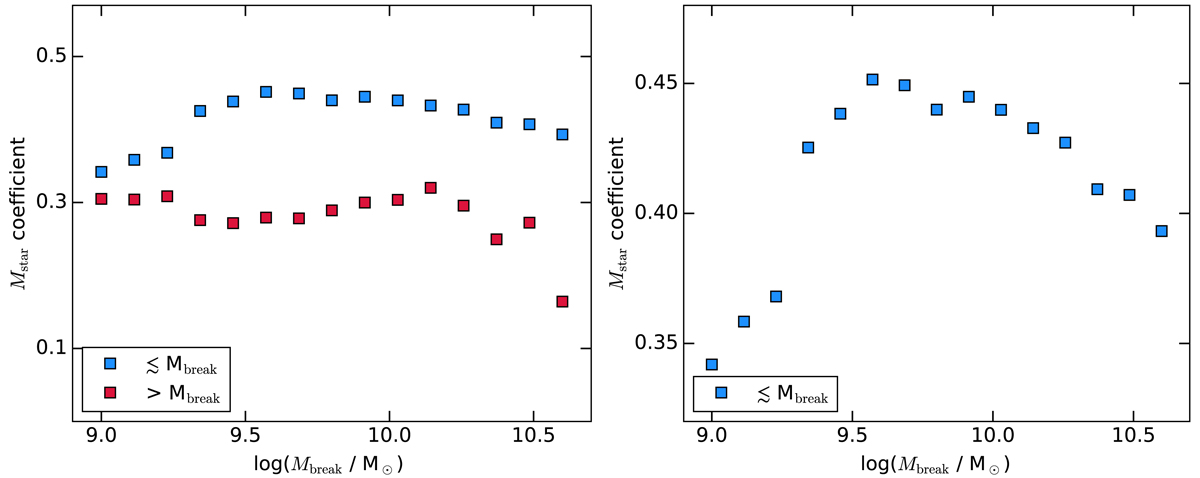
PCA coefficients for MAGMA log(Mstar) plotted against Mbreak for the division into the two PCAs. Right panel: magnification of the left panel, showing, more effectively, that the range of Mstar coefficients as the Mbreak mass is varied. The lower values of the Mstar coefficient toward higher Mbreak results from the flattening of the MZR at high Mstar.
Current usage metrics show cumulative count of Article Views (full-text article views including HTML views, PDF and ePub downloads, according to the available data) and Abstracts Views on Vision4Press platform.
Data correspond to usage on the plateform after 2015. The current usage metrics is available 48-96 hours after online publication and is updated daily on week days.
Initial download of the metrics may take a while.