Fig. 5.
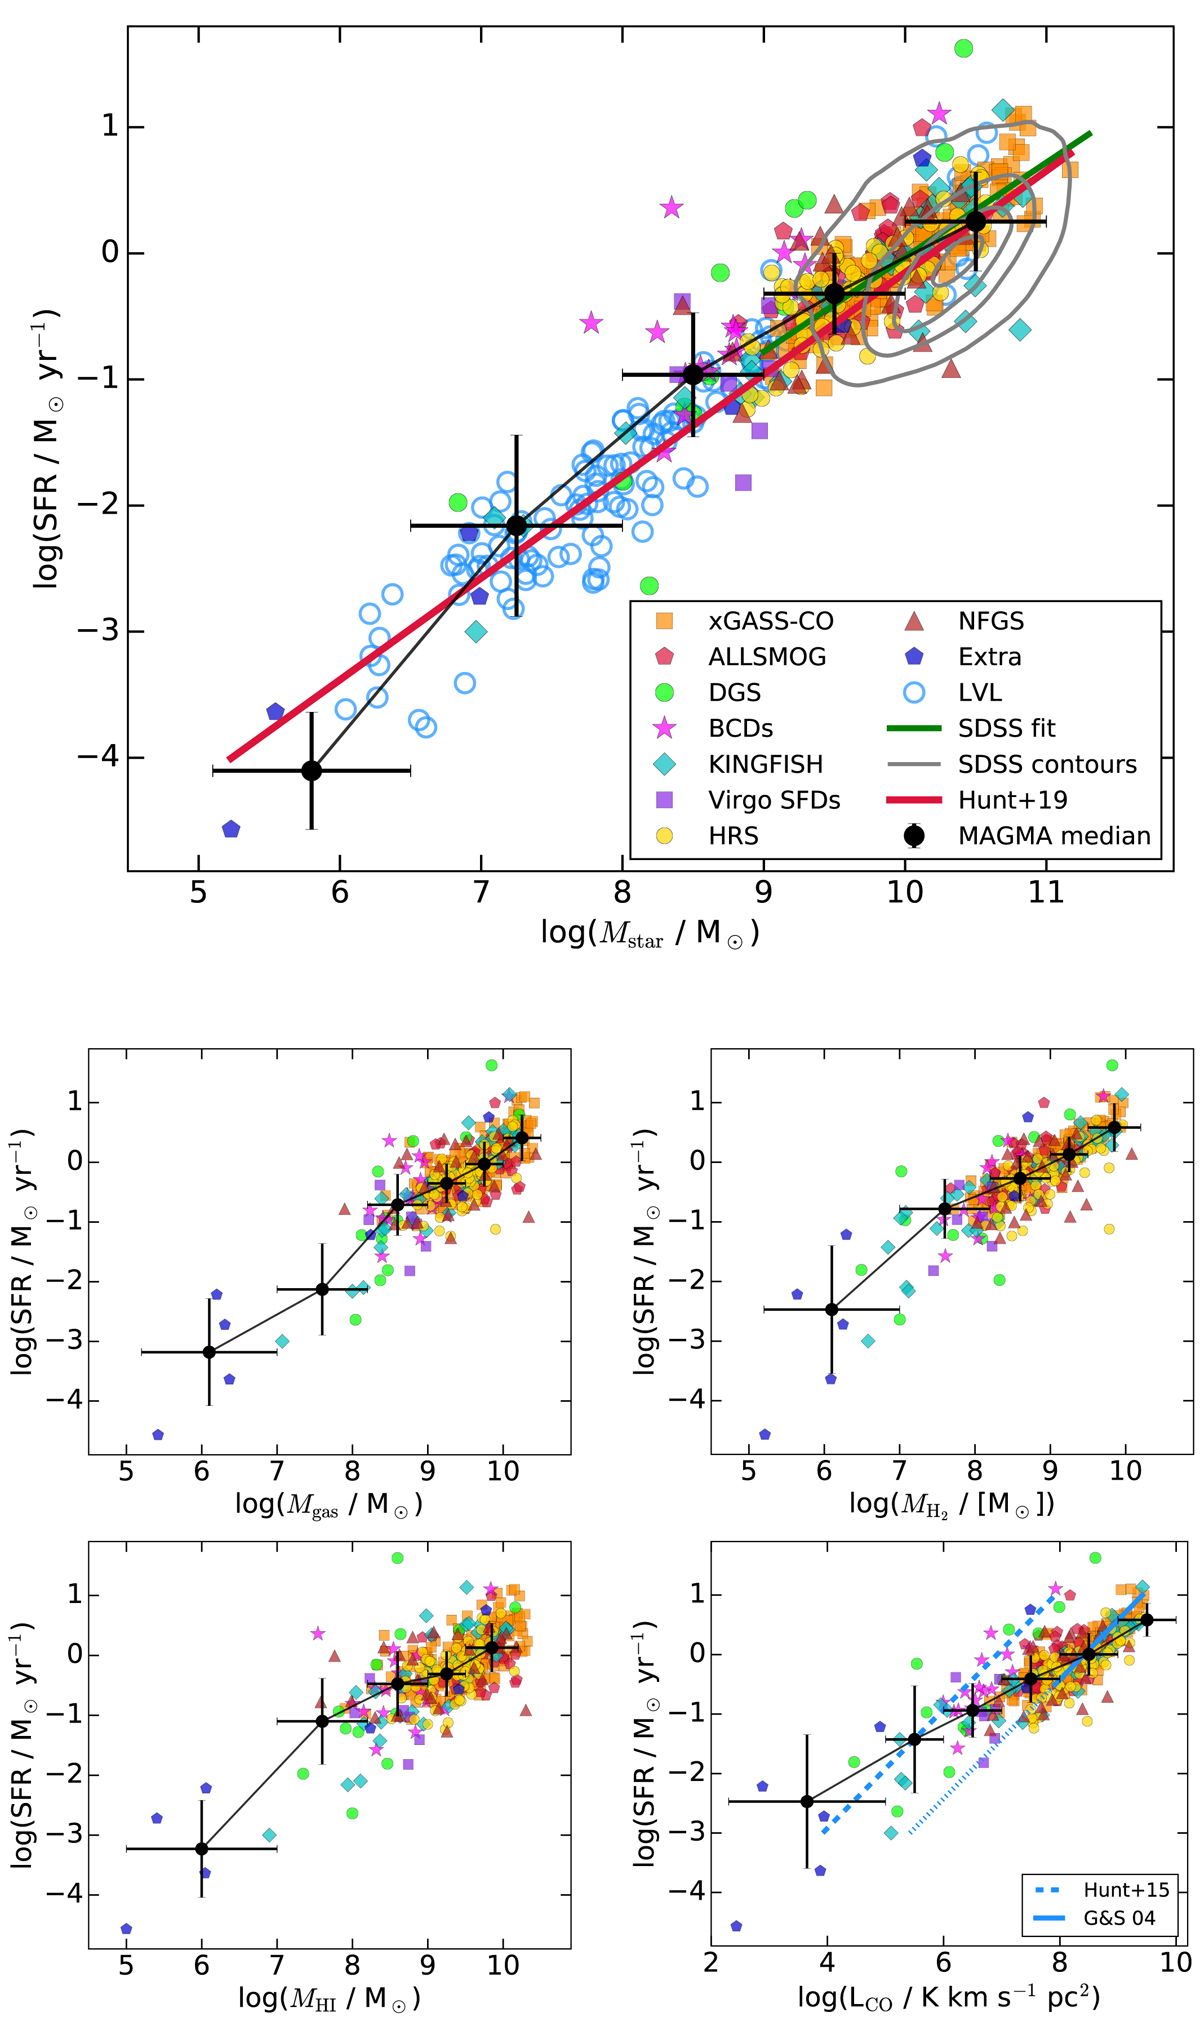
Upper panel: galaxies from the MAGMA sample plotted in the SFR–Mstar plane. The green line is the MS of star-forming galaxies derived from the SDSS (Brinchmann et al. 2004). Contours in this plane for the SDSS10 sample are shown as gray closed curves; the lowest level contour encloses 90% of the sample. The LVL sample (Dale et al. 2009; Kennicutt et al. 2009), as described in the text, is also shown in the upper panels. Lower panels: MAGMA galaxies in the SFR–Mgas (upper-left), MH2–SFR (upper-right), MHI–SFR (lower-left), and ![]() –SFR (lower-right) planes. Symbols and colors refer to different parent surveys, as indicated in the legend. In all panels, the gray lines represent the median trends of the MAGMA distributions, calculated at different bins (see black dots; horizontal bars indicate the widths of the bins, while vertical bars indicate the standard deviation around median values of galaxies in the bins). Lower right panel: the blue solid line is the fit relating
–SFR (lower-right) planes. Symbols and colors refer to different parent surveys, as indicated in the legend. In all panels, the gray lines represent the median trends of the MAGMA distributions, calculated at different bins (see black dots; horizontal bars indicate the widths of the bins, while vertical bars indicate the standard deviation around median values of galaxies in the bins). Lower right panel: the blue solid line is the fit relating ![]() and SFR from Gao & Solomon (2004), and the dotted line, which is roughly parallel to it but offset by roughly a factor of 30, is the analogous fit for low-metallicity dwarf galaxies by Hunt et al. (2015). The dotted extension of the regression found by Gao & Solomon (2004) reflects the range of parameters for which they calibrated the relation.
and SFR from Gao & Solomon (2004), and the dotted line, which is roughly parallel to it but offset by roughly a factor of 30, is the analogous fit for low-metallicity dwarf galaxies by Hunt et al. (2015). The dotted extension of the regression found by Gao & Solomon (2004) reflects the range of parameters for which they calibrated the relation.
Current usage metrics show cumulative count of Article Views (full-text article views including HTML views, PDF and ePub downloads, according to the available data) and Abstracts Views on Vision4Press platform.
Data correspond to usage on the plateform after 2015. The current usage metrics is available 48-96 hours after online publication and is updated daily on week days.
Initial download of the metrics may take a while.