Fig. 3.
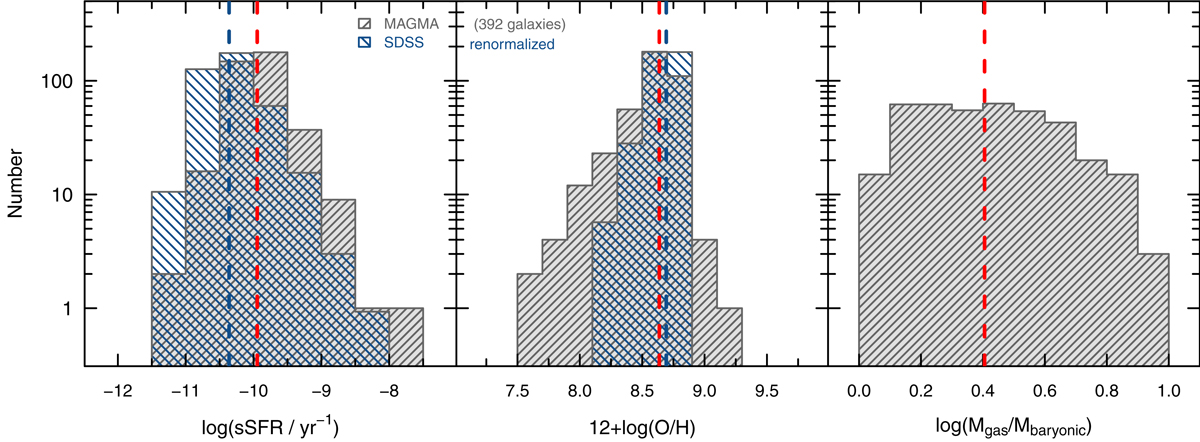
Distributions for combined sample of 392 galaxies for log (sSFR) (left panel), 12 + log(O/H) (middle), and log [Mgas/(Mstar + Mgas) ≡ Mgas/Mbaryonic] (right). The red vertical dashed lines in each panel correspond to the MAGMA medians: log(sSFR/yr−1) = −9.92; 12 + log(O/H) = 8.64 (Z⊙ would be 12 + log(O/H) = 8.69, see Asplund et al. 2009); and log(Mgas/Mbaryonic) = log(fbaryonic) = 0.39. The left and middle panels also include the SDSS10 sample, as in Fig. 2; the sSFR and O/H medians of SDSS10 are log(sSFR/yr−1) = −10.36 and 12 + log(O/H) = 8.69, respectively, and they are shown by blue vertical dashed lines.
Current usage metrics show cumulative count of Article Views (full-text article views including HTML views, PDF and ePub downloads, according to the available data) and Abstracts Views on Vision4Press platform.
Data correspond to usage on the plateform after 2015. The current usage metrics is available 48-96 hours after online publication and is updated daily on week days.
Initial download of the metrics may take a while.