Fig. 2.
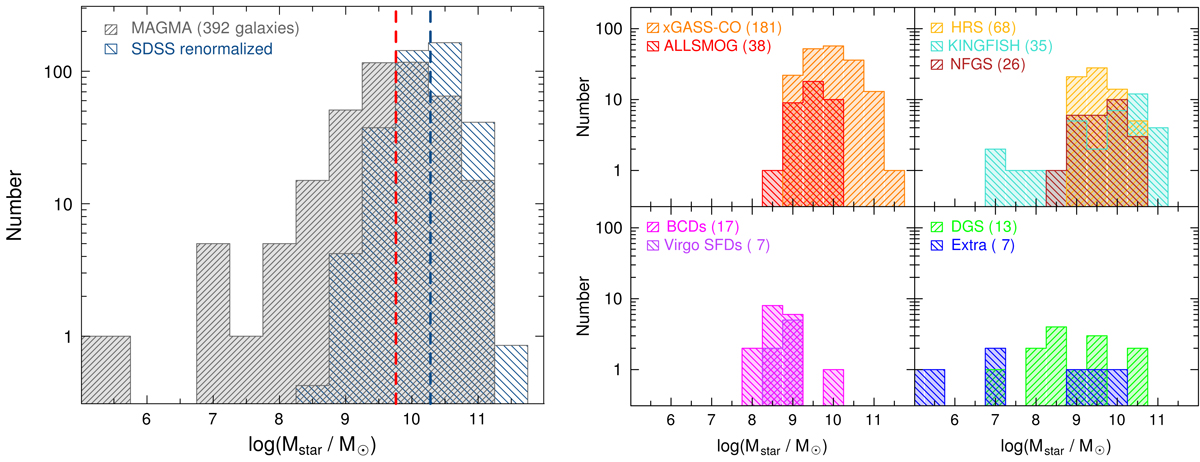
Distributions of Mstar for the MAGMA sample; the right panels illustrate the subdivisions in Mstar for the parent surveys. The red vertical dashed line in the left panel corresponds to the median Mstar for MAGMA, log(Mstar/M⊙) = 9.68. Also shown in the left panel is the SDSS10 sample, taken from Mannucci et al. (2010), consisting of 78579 galaxies. Here, it has been renormalized to show the Mstar distribution it would have if it contained the same number of galaxies (390) as MAGMA; the Mstar median of SDSS10 (shown as a blue vertical dashed line) is log(Mstar/M⊙) = 10.28.
Current usage metrics show cumulative count of Article Views (full-text article views including HTML views, PDF and ePub downloads, according to the available data) and Abstracts Views on Vision4Press platform.
Data correspond to usage on the plateform after 2015. The current usage metrics is available 48-96 hours after online publication and is updated daily on week days.
Initial download of the metrics may take a while.