Fig. C.2.
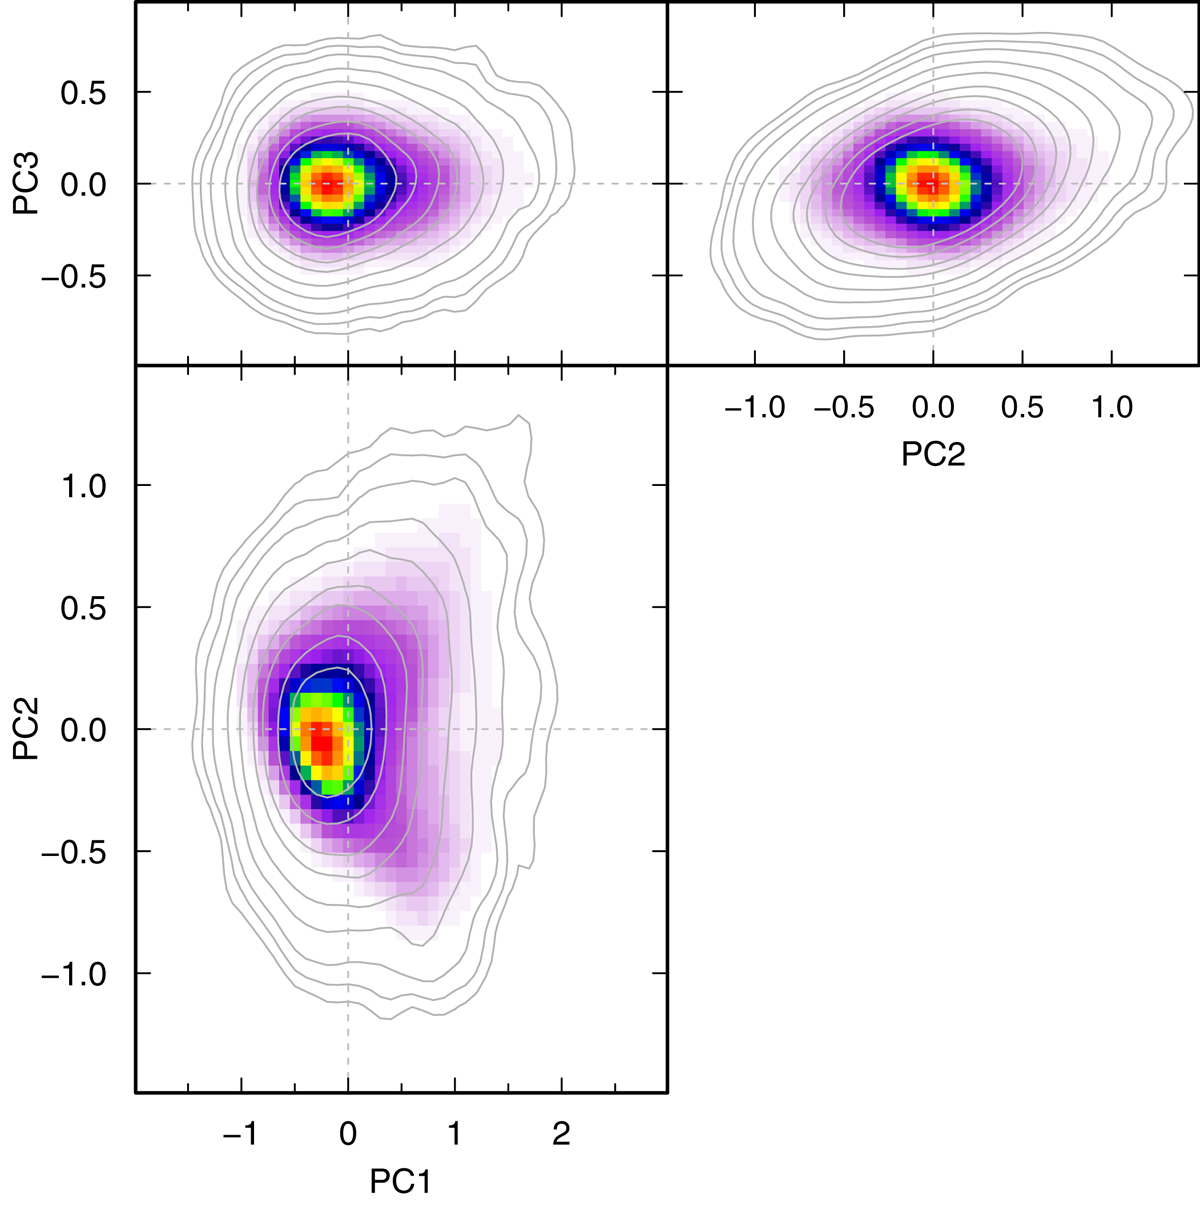
3D PC components under various projections. The underlying color maps show the density distribution of data points with the PCA calculated from the original mock sample with σ = 0.15 dex and the contours of the density distribution of the perturbed sample but with the PCA loadings of the original one. The change of orientation of the PC decomposition introduced by the perturbation is evident, especially in the upper right panel.
Current usage metrics show cumulative count of Article Views (full-text article views including HTML views, PDF and ePub downloads, according to the available data) and Abstracts Views on Vision4Press platform.
Data correspond to usage on the plateform after 2015. The current usage metrics is available 48-96 hours after online publication and is updated daily on week days.
Initial download of the metrics may take a while.