Fig. C.1.
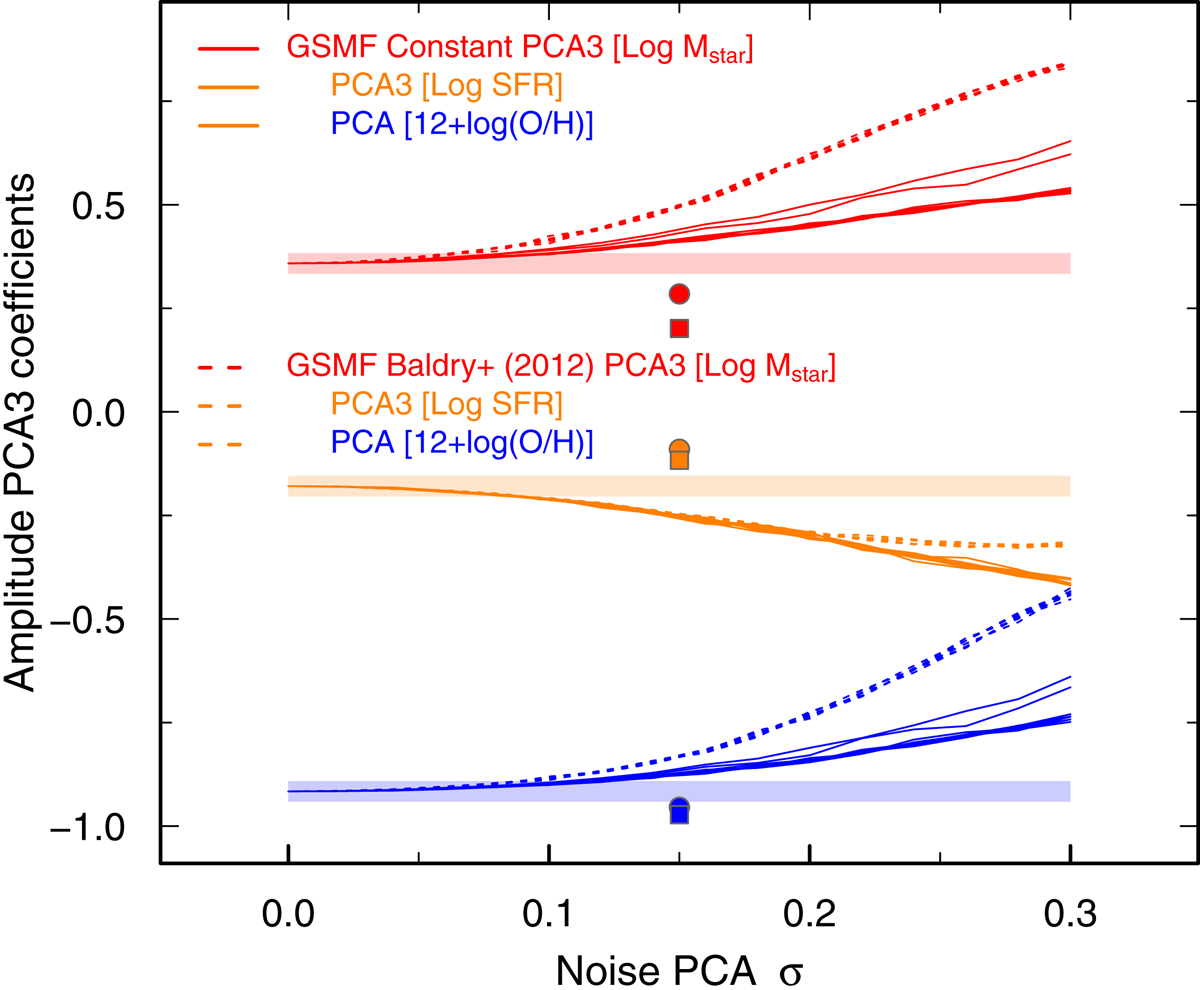
3D PCA coefficients for Log(Mstar) (in red), Log(SFR) (in orange), and 12 + log(O/H) (in blue) plotted against the injected noise level σ; different line types correspond to the two different Mstar distributions as described in the text and illustrated in the legend. The different curves for the constant Mstar case correspond to different lower-mass limits. The true input of 3DPCA2(OH) is shown by the transparent lines, with a thickness of ±0.025 dex. The data points, including error bars that are smaller than the symbols, report the PCA coefficients from the initial σ = 0.15 dex mock sample, but which has been in turn perturbed as described in the text. The aim of this subsequent exercise is to simulate a Monte Carlo perturbation of an observed sample.
Current usage metrics show cumulative count of Article Views (full-text article views including HTML views, PDF and ePub downloads, according to the available data) and Abstracts Views on Vision4Press platform.
Data correspond to usage on the plateform after 2015. The current usage metrics is available 48-96 hours after online publication and is updated daily on week days.
Initial download of the metrics may take a while.