Fig. B.1.
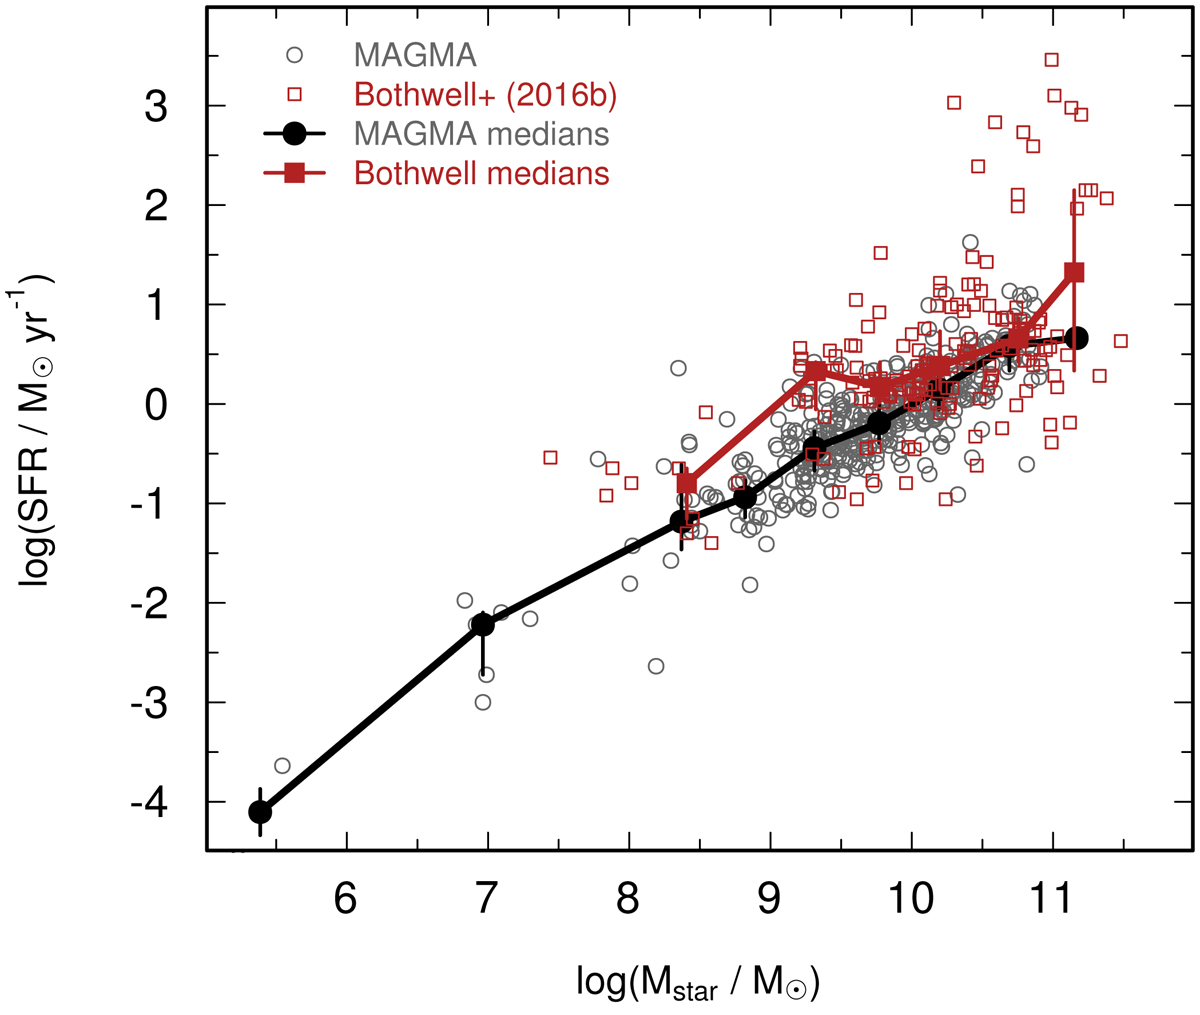
Log(SFR) versus Log(Mstar) for the MAGMA sample as in Fig. 5, but here we plotted also the galaxies from Bothwell et al. (2016b, see their Table 2), together with the eight galaxies from Hunt et al. (2015) (we used a reduced Mstar as described in the main text). Medians for both samples are also shown, but only medians with ≥3 points in the respective Mstar bins are plotted here.
Current usage metrics show cumulative count of Article Views (full-text article views including HTML views, PDF and ePub downloads, according to the available data) and Abstracts Views on Vision4Press platform.
Data correspond to usage on the plateform after 2015. The current usage metrics is available 48-96 hours after online publication and is updated daily on week days.
Initial download of the metrics may take a while.