Fig. 4
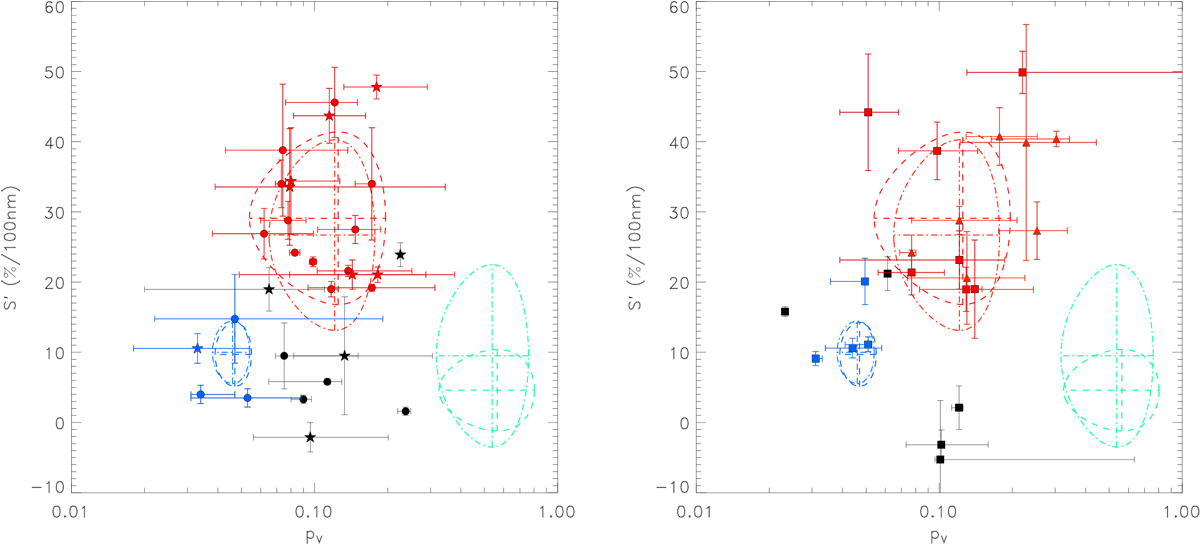
Spectral slope vs. geometric albedo for resonant (left), and scattered disk and detached objects (right). Regions delineated with dashed and dash-dotted lines correspond to the 1 σ contours of the clusters identified in our analysis using the original and full samples, respectively. Filled circles and stars mark plutinos (3:2 resonance) and other resonant objects, respectively, in the left panel. Filled squares and triangles indicate scattered disk and detached objects in the right panel. Black symbols indicate objects with ambiguous cluster assignments.
Current usage metrics show cumulative count of Article Views (full-text article views including HTML views, PDF and ePub downloads, according to the available data) and Abstracts Views on Vision4Press platform.
Data correspond to usage on the plateform after 2015. The current usage metrics is available 48-96 hours after online publication and is updated daily on week days.
Initial download of the metrics may take a while.