Fig. 3
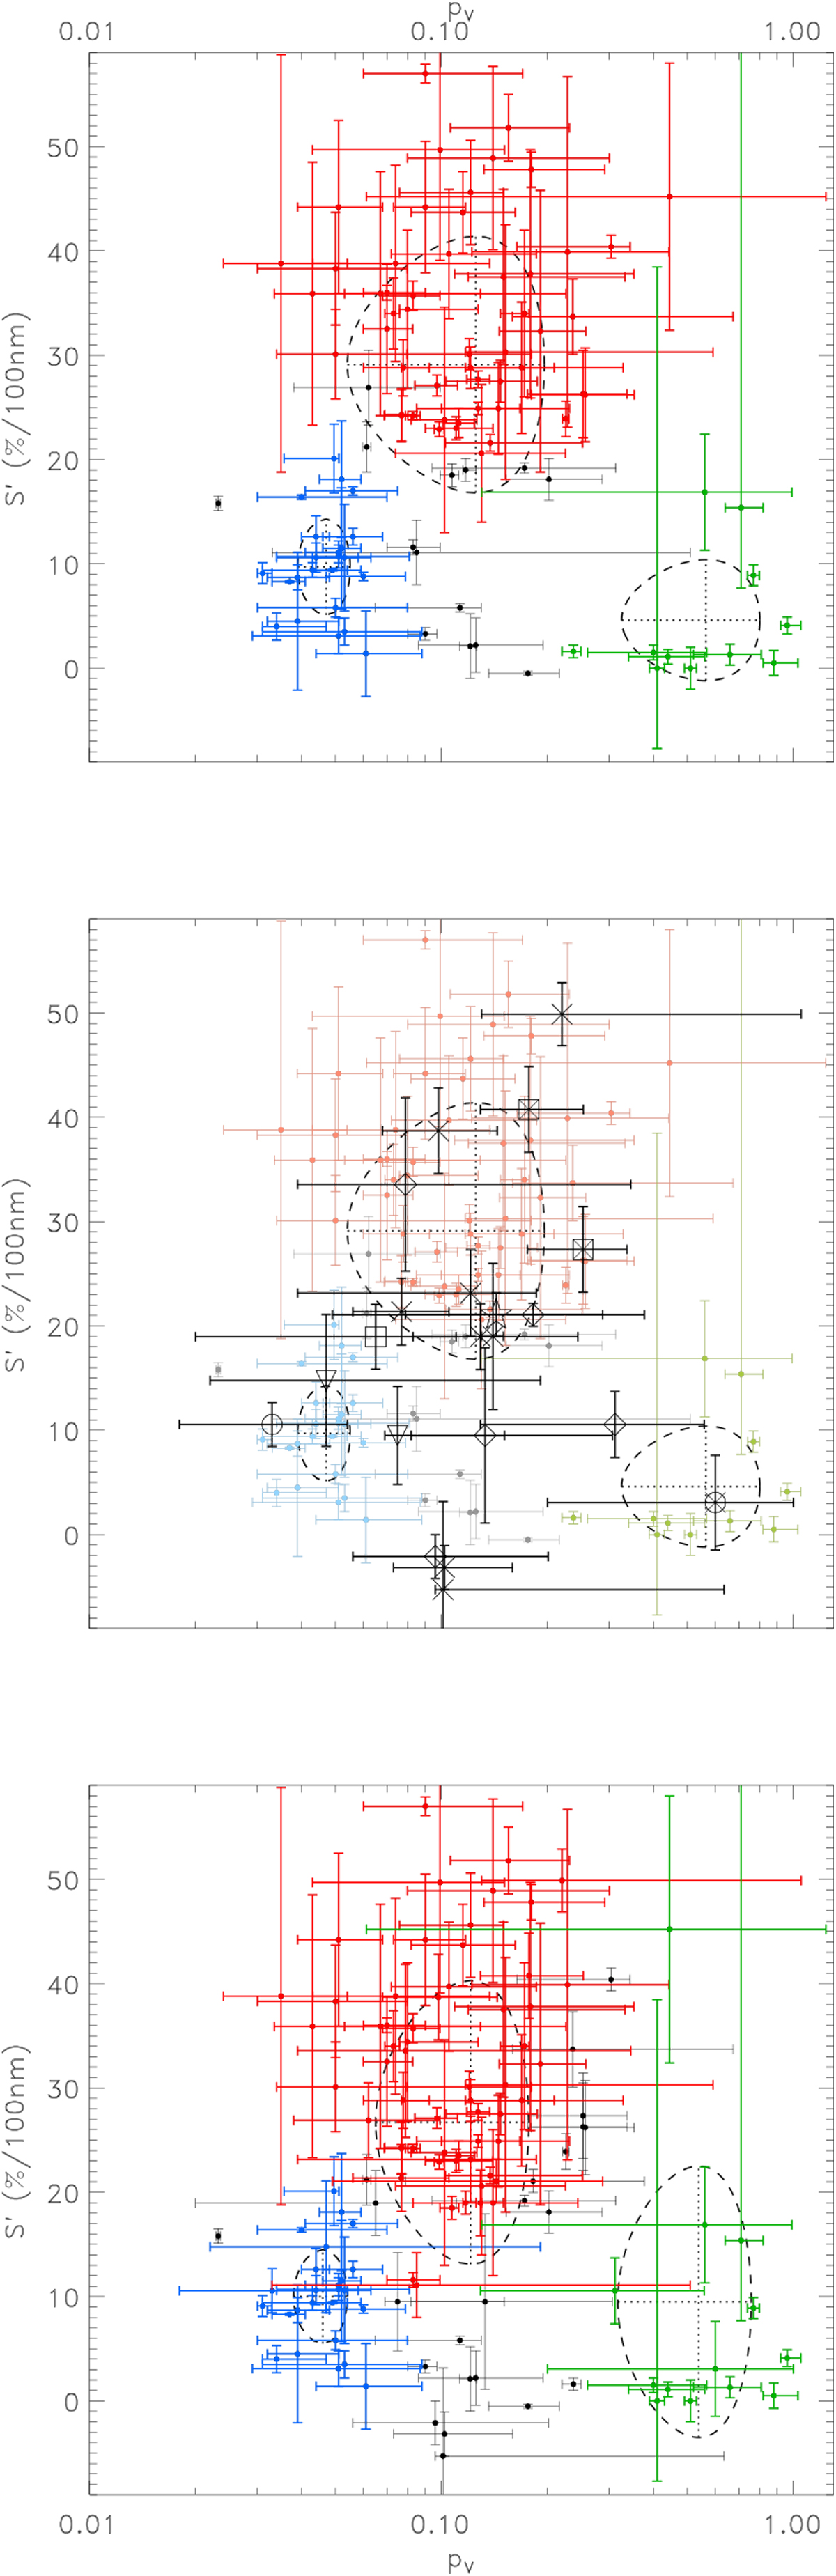
Albedo vs. visible color, quantified by the spectral slope S′. Upper panel: TNOs from Lacerda et al. (2014) using updated albedo and spectral slope values in some specific cases. The three clusters identified are indicated in blue, red, and green. Ellipses (distorted due to the logarithmic pV scale) with crosshairs indicating the centers and variance values of the clusters in the albedo–spectral slope plane. Objects indicated by black symbols have ambiguous identifications. Middle panel: same as the top panel (TNOs from Lacerda et al. 2014), but with the new objects of the present paper overplotted. The following symbols were used: ▿ – plutinos; ⊠ – detached objects; × – scattered disk objects; ◊ – outer resonants; ○ – inner resonants; ⋆ – middle resonants; □ – 1999 CD158 (Vilenius et al. 2018); ⊗ – 1996 TO66 (Vilenius et al. 2018). Bottom panel: clusters in the albedo vs. spectral slope plot using all 120 objects, including those from Lacerda et al. (2014) and the new targets from the present paper.
Current usage metrics show cumulative count of Article Views (full-text article views including HTML views, PDF and ePub downloads, according to the available data) and Abstracts Views on Vision4Press platform.
Data correspond to usage on the plateform after 2015. The current usage metrics is available 48-96 hours after online publication and is updated daily on week days.
Initial download of the metrics may take a while.