Fig. 1
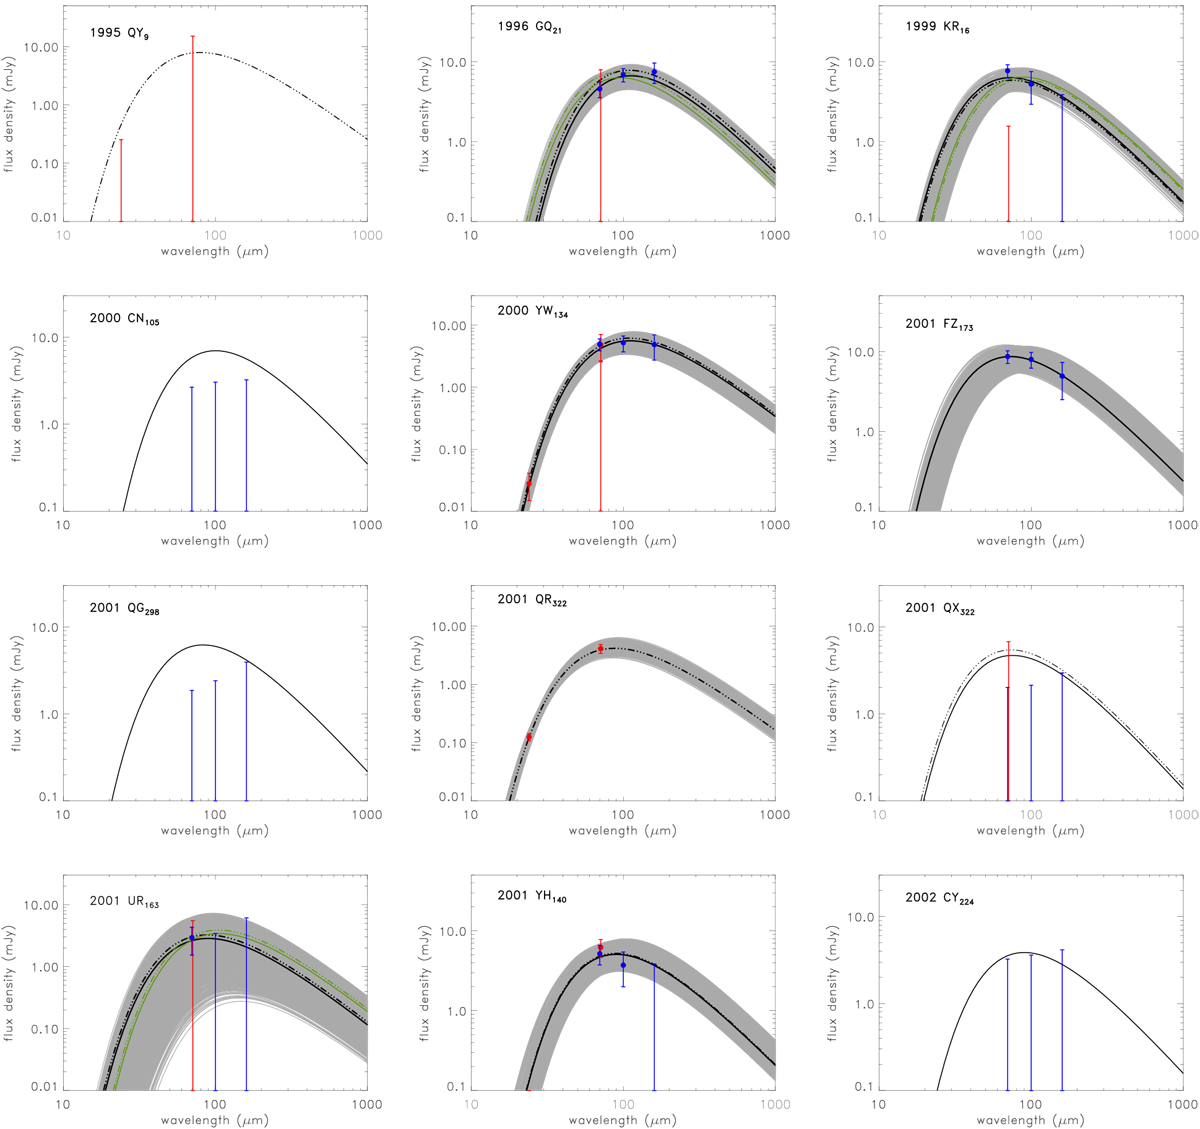
NEATM fits of the thermal emission of our target sample. Black solid and dash-dotted curves represent the spectral energy distribution of the best-fit (lowest χ2) model for the epochs of the PACS and MIPS measurements, respectively. The gray area shows the zone of NEATM model curves that are compatible with the observed measurement uncertainties. In those cases when the floating η fits converged to one of the beaming parameter limits, the fit was repeated with a fixed beaming parameter of η = 1.25, represented by the green curves (not in all panels). Red and blue symbols represent the measured MIPS and PACS flux densities, respectively, color-corrected according to the best-fit NEATM model, at their respective epochs. In those cases when only flux density upper limits were available, we show the SED of the NEATM model with the diameter and geometric albedo limits presented in Table 4.
Current usage metrics show cumulative count of Article Views (full-text article views including HTML views, PDF and ePub downloads, according to the available data) and Abstracts Views on Vision4Press platform.
Data correspond to usage on the plateform after 2015. The current usage metrics is available 48-96 hours after online publication and is updated daily on week days.
Initial download of the metrics may take a while.