Fig. 9.
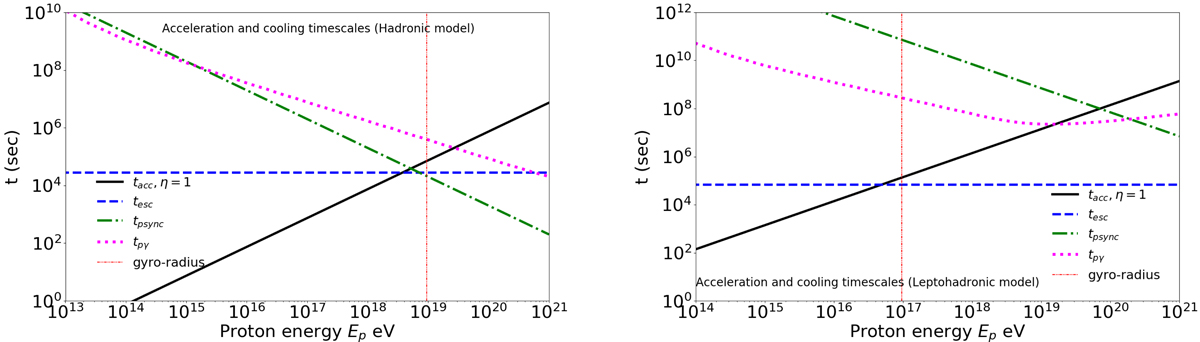
Comparison between acceleration timescale (solid black line with acceleration efficiency ηacc = 1) and different cooling timescales (tesc, tpsync, tpγ) for the hadronic (left panel) and lepto-hadronic (right panel) scenarios of 13 June 2016. Also shown is the energy at which the proton gyro-radius becomes equal to the radius of the emission region (dot-dashed red line).
Current usage metrics show cumulative count of Article Views (full-text article views including HTML views, PDF and ePub downloads, according to the available data) and Abstracts Views on Vision4Press platform.
Data correspond to usage on the plateform after 2015. The current usage metrics is available 48-96 hours after online publication and is updated daily on week days.
Initial download of the metrics may take a while.