Fig. 7.
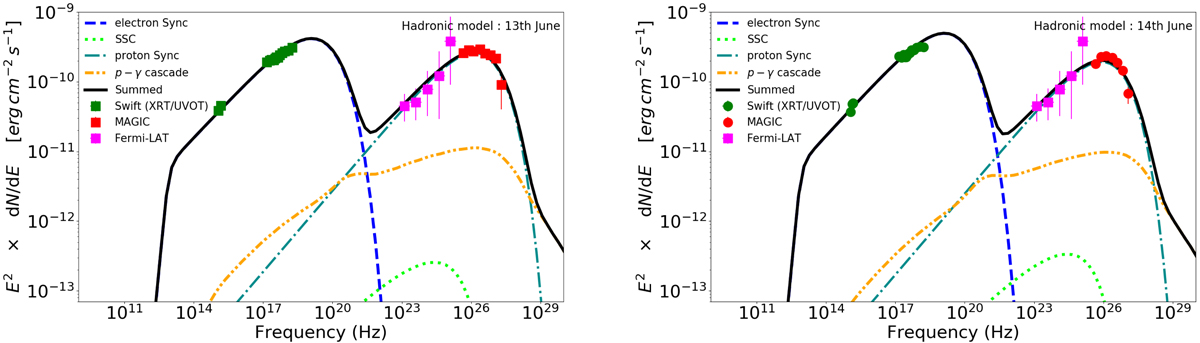
One-zone hadronic models applied to 13 June (left panel) and 14 June (right panel) 2016. The symbols corresponding to the data from different instruments are given in the legend. Solid black line: summed; dashed blue line: electron-synchrotron; dotted green line: SSC; dot-dashed sea green line: proton-synchrotron; dot-dot-dashed orange line: p − γ cascade. The higher energy peak in the SED is dominated by synchrotron radiation by relativistic protons, which can be achieved with B ∼ 100 G and Ep, max > 1018 eV and jet power Lj ∼ 1046 erg s−1 (∼LEdd). For more details see the discussion in Sect. 4.3.2 and the parameters in Table 4.
Current usage metrics show cumulative count of Article Views (full-text article views including HTML views, PDF and ePub downloads, according to the available data) and Abstracts Views on Vision4Press platform.
Data correspond to usage on the plateform after 2015. The current usage metrics is available 48-96 hours after online publication and is updated daily on week days.
Initial download of the metrics may take a while.