Fig. 4.
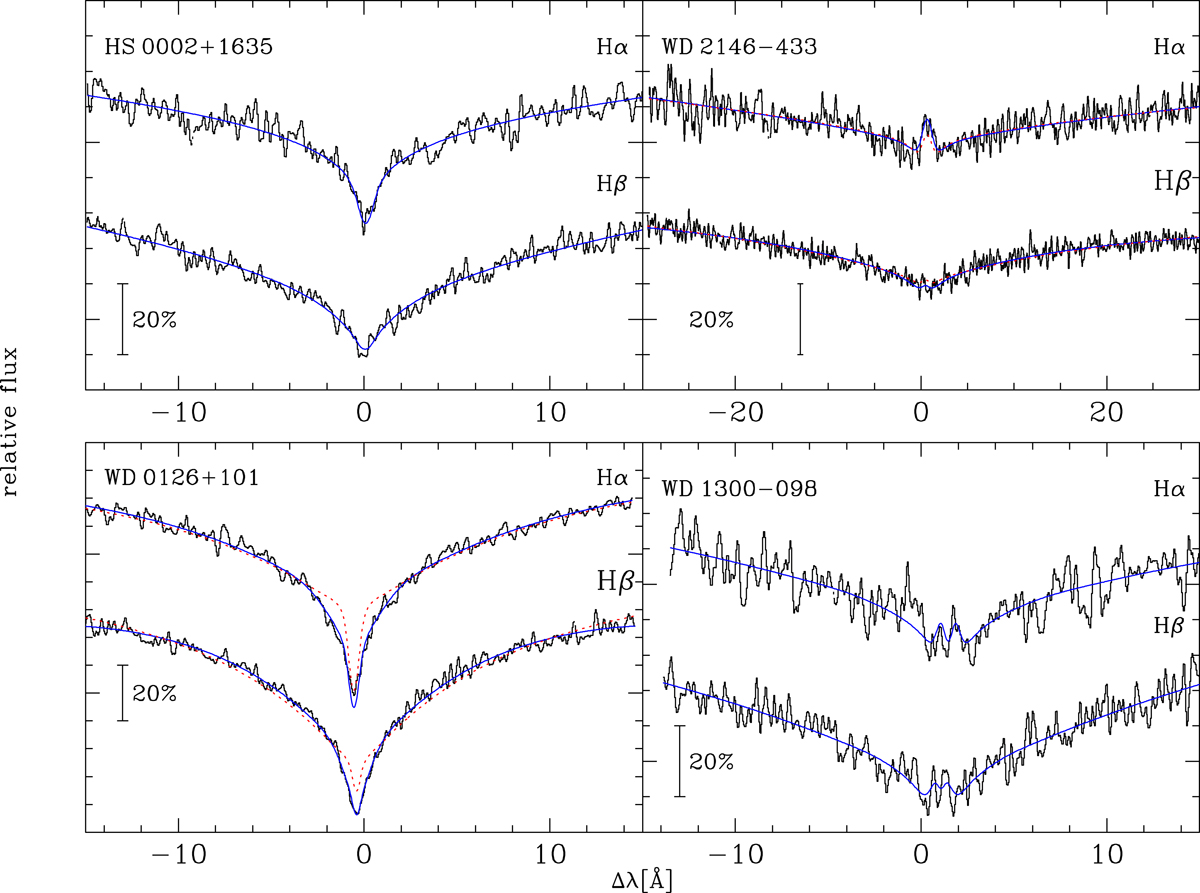
Observed Hα and Hβ profiles compared to the fitted model spectrum. The graph shows one observed spectrum for each binary and the best fitting model spectrum (blue smooth line). Here and in the following figures we display the observed spectra smoothed with a Gaussian of 0.15 Å FWHM, hardly affecting the spectral resolution. Δλ is the wavelength offset relative to the laboratory wavelengths of Hα and Hβ, respectively. Top left: HS 0002+1635, fitted with model spectra without modifications. Top right: WD 2146−433, a hot DA with a Gaussian added to better reproduce the central emission core (model spectrum without correction shown as dashed red line). Bottom left: WD 0126+101, one of the cool DAs displaying a broader and stronger central core than predicted by the models (model spectrum without correction shown as dashed red line). Bottom right: WD 1300−098, one of the magnetic white dwarfs.
Current usage metrics show cumulative count of Article Views (full-text article views including HTML views, PDF and ePub downloads, according to the available data) and Abstracts Views on Vision4Press platform.
Data correspond to usage on the plateform after 2015. The current usage metrics is available 48-96 hours after online publication and is updated daily on week days.
Initial download of the metrics may take a while.