Fig. 14.
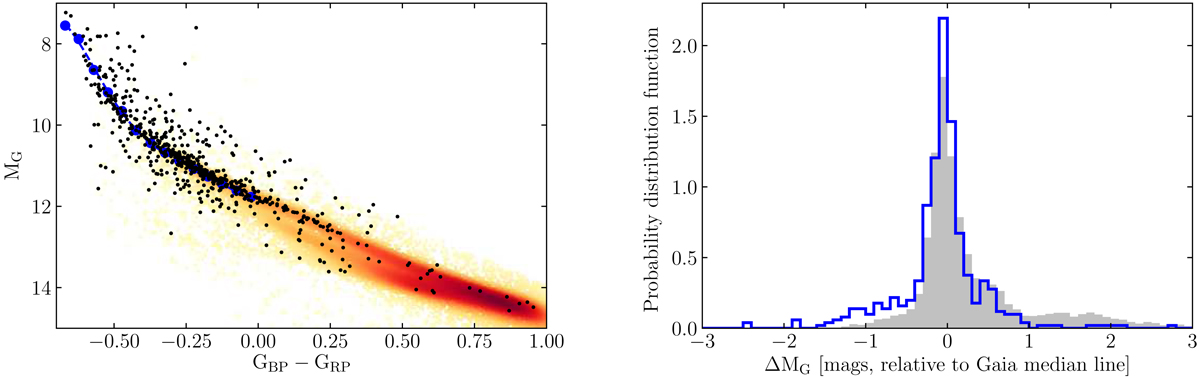
Left: SPY sample (black dots) plotted in a Hertzsprung–Russell diagram (Gaia absolute magnitude versus Gaia colour) on top of a background of 11 561 white dwarf candidates selected from the Gaia-derived sample of Gentile Fusillo et al. (2019) and colour-coded by plot density. The large blue dots on the left mark the main cooling track of the Gaia white dwarfs for GBP − GRP > 0. The dashed line represents the polynomial fitted to the brightness distribution. Right: histograms of the differential magnitudes for Gaia (solid grey) and SPY (outline blue).
Current usage metrics show cumulative count of Article Views (full-text article views including HTML views, PDF and ePub downloads, according to the available data) and Abstracts Views on Vision4Press platform.
Data correspond to usage on the plateform after 2015. The current usage metrics is available 48-96 hours after online publication and is updated daily on week days.
Initial download of the metrics may take a while.