Fig. 10.
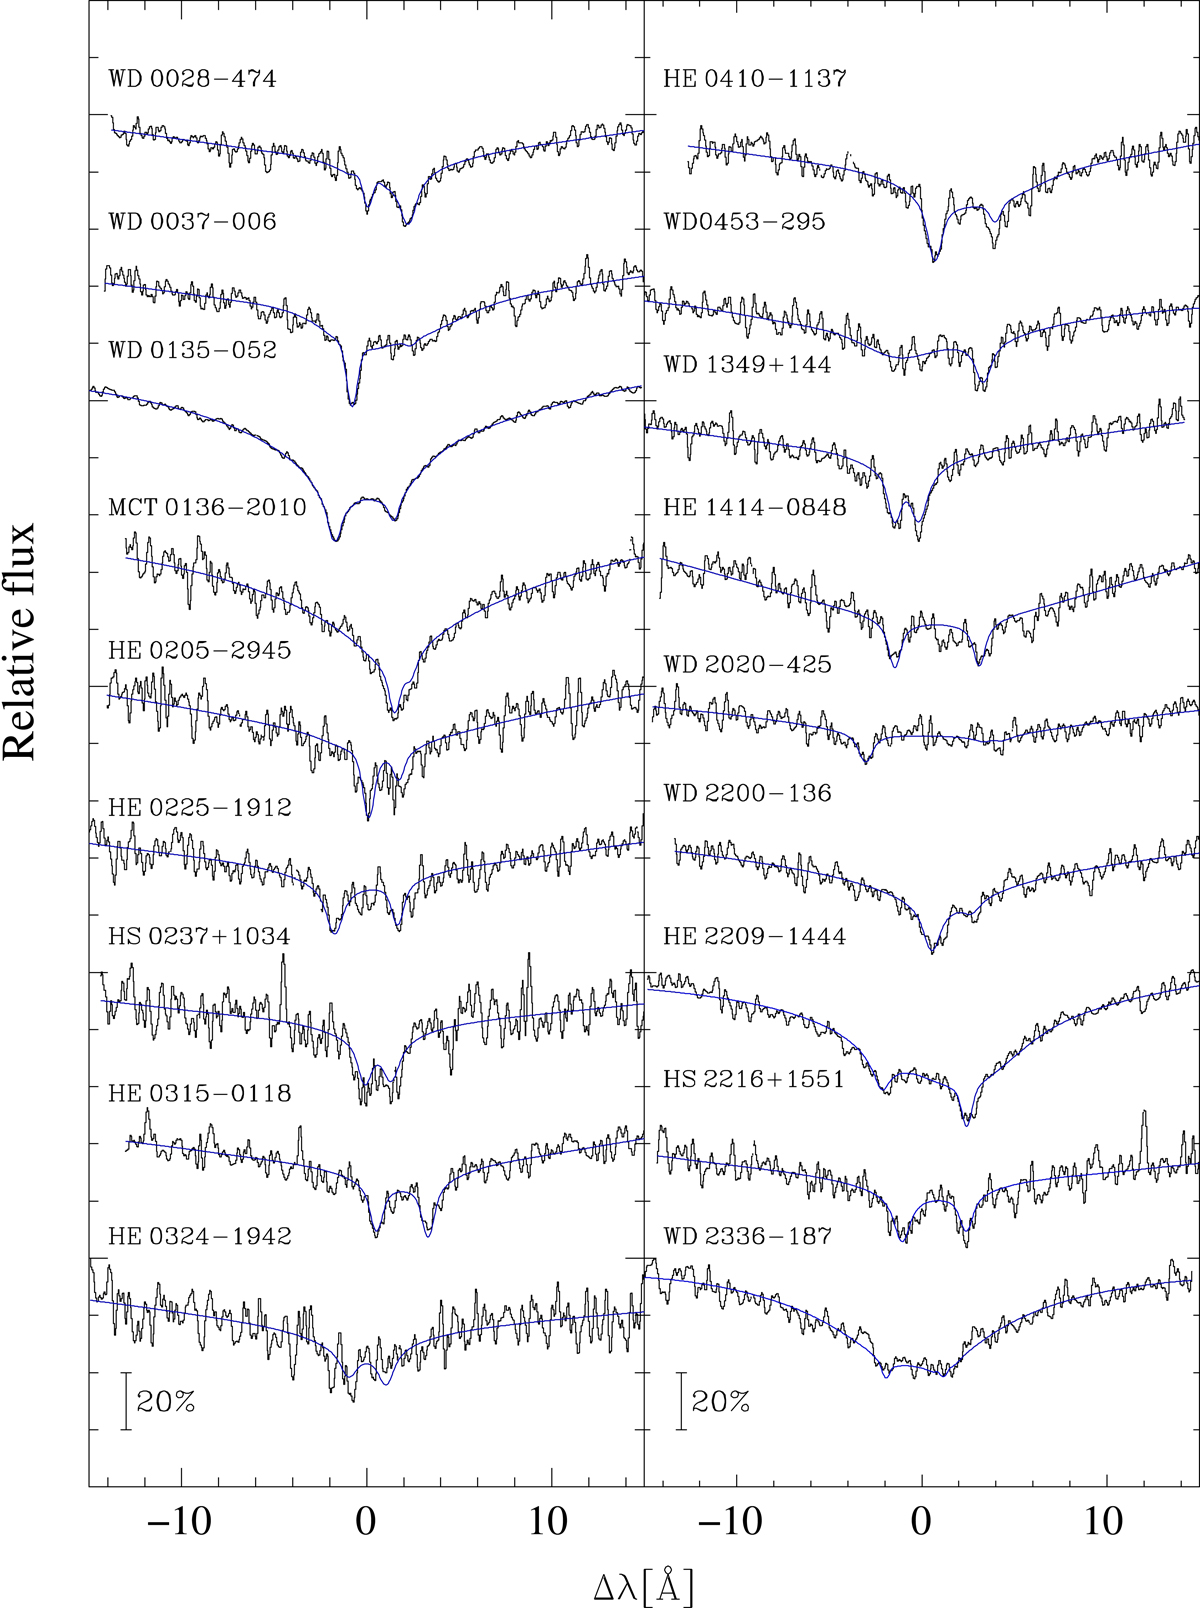
Hα region of 18 of the 20 the double-lined systems detected in the survey. Each system shown displays two Hα cores; the two systems excluded, WD 0128−387 and WD 1115+166, are DABs and show only a single component at Hα. The figure shows one observed spectrum for each binary along with the best fitting model spectrum (blue smooth line). The observed spectra were smoothed with a Gaussian with 0.15 Å for display. Δλ is the wavelength offset relative to the laboratory wavelength of Hα.
Current usage metrics show cumulative count of Article Views (full-text article views including HTML views, PDF and ePub downloads, according to the available data) and Abstracts Views on Vision4Press platform.
Data correspond to usage on the plateform after 2015. The current usage metrics is available 48-96 hours after online publication and is updated daily on week days.
Initial download of the metrics may take a while.